This project deployed a tool designed to identify, track, and visualise disruption data related to accessibility across the Transport for London (TfL) network. I wanted to come up with a project that tested my use of APIs, live reporting, and dashboard by creating an accessibility solution after hearing the issues users face across public transport from a Policy Connect Ressearch Fellow.
Project Overview
The Challenge
User Side:
For many passengers with accessibility needs, being informed about a station's step-free status is a hassle. All too often people only find out lifts are out of service when they reach a station, delaying their journey and causing undue stress.
While Transport for London (TfL) does publish accessibility and disruption information, it is often:
- Hard to navigate in real-time
- Not centralised for accessibility concerns
- Lacking historical insight into how often disruptions affect certain stations
Technical:
Aside from the user case, the project involved working with several tools I was previously unfamiliar with.
These included:
- Navigating the TfL Unified API for the first time
- Working with live data
- Utilising Airflow for data processing
- Ensuring low-latency response times to notify users live
Solution & Approach
I aimed to address this issue through the following implementations:
- Providing a filterable, visual dashboard of accessibility-related disruptions (Streamlit)
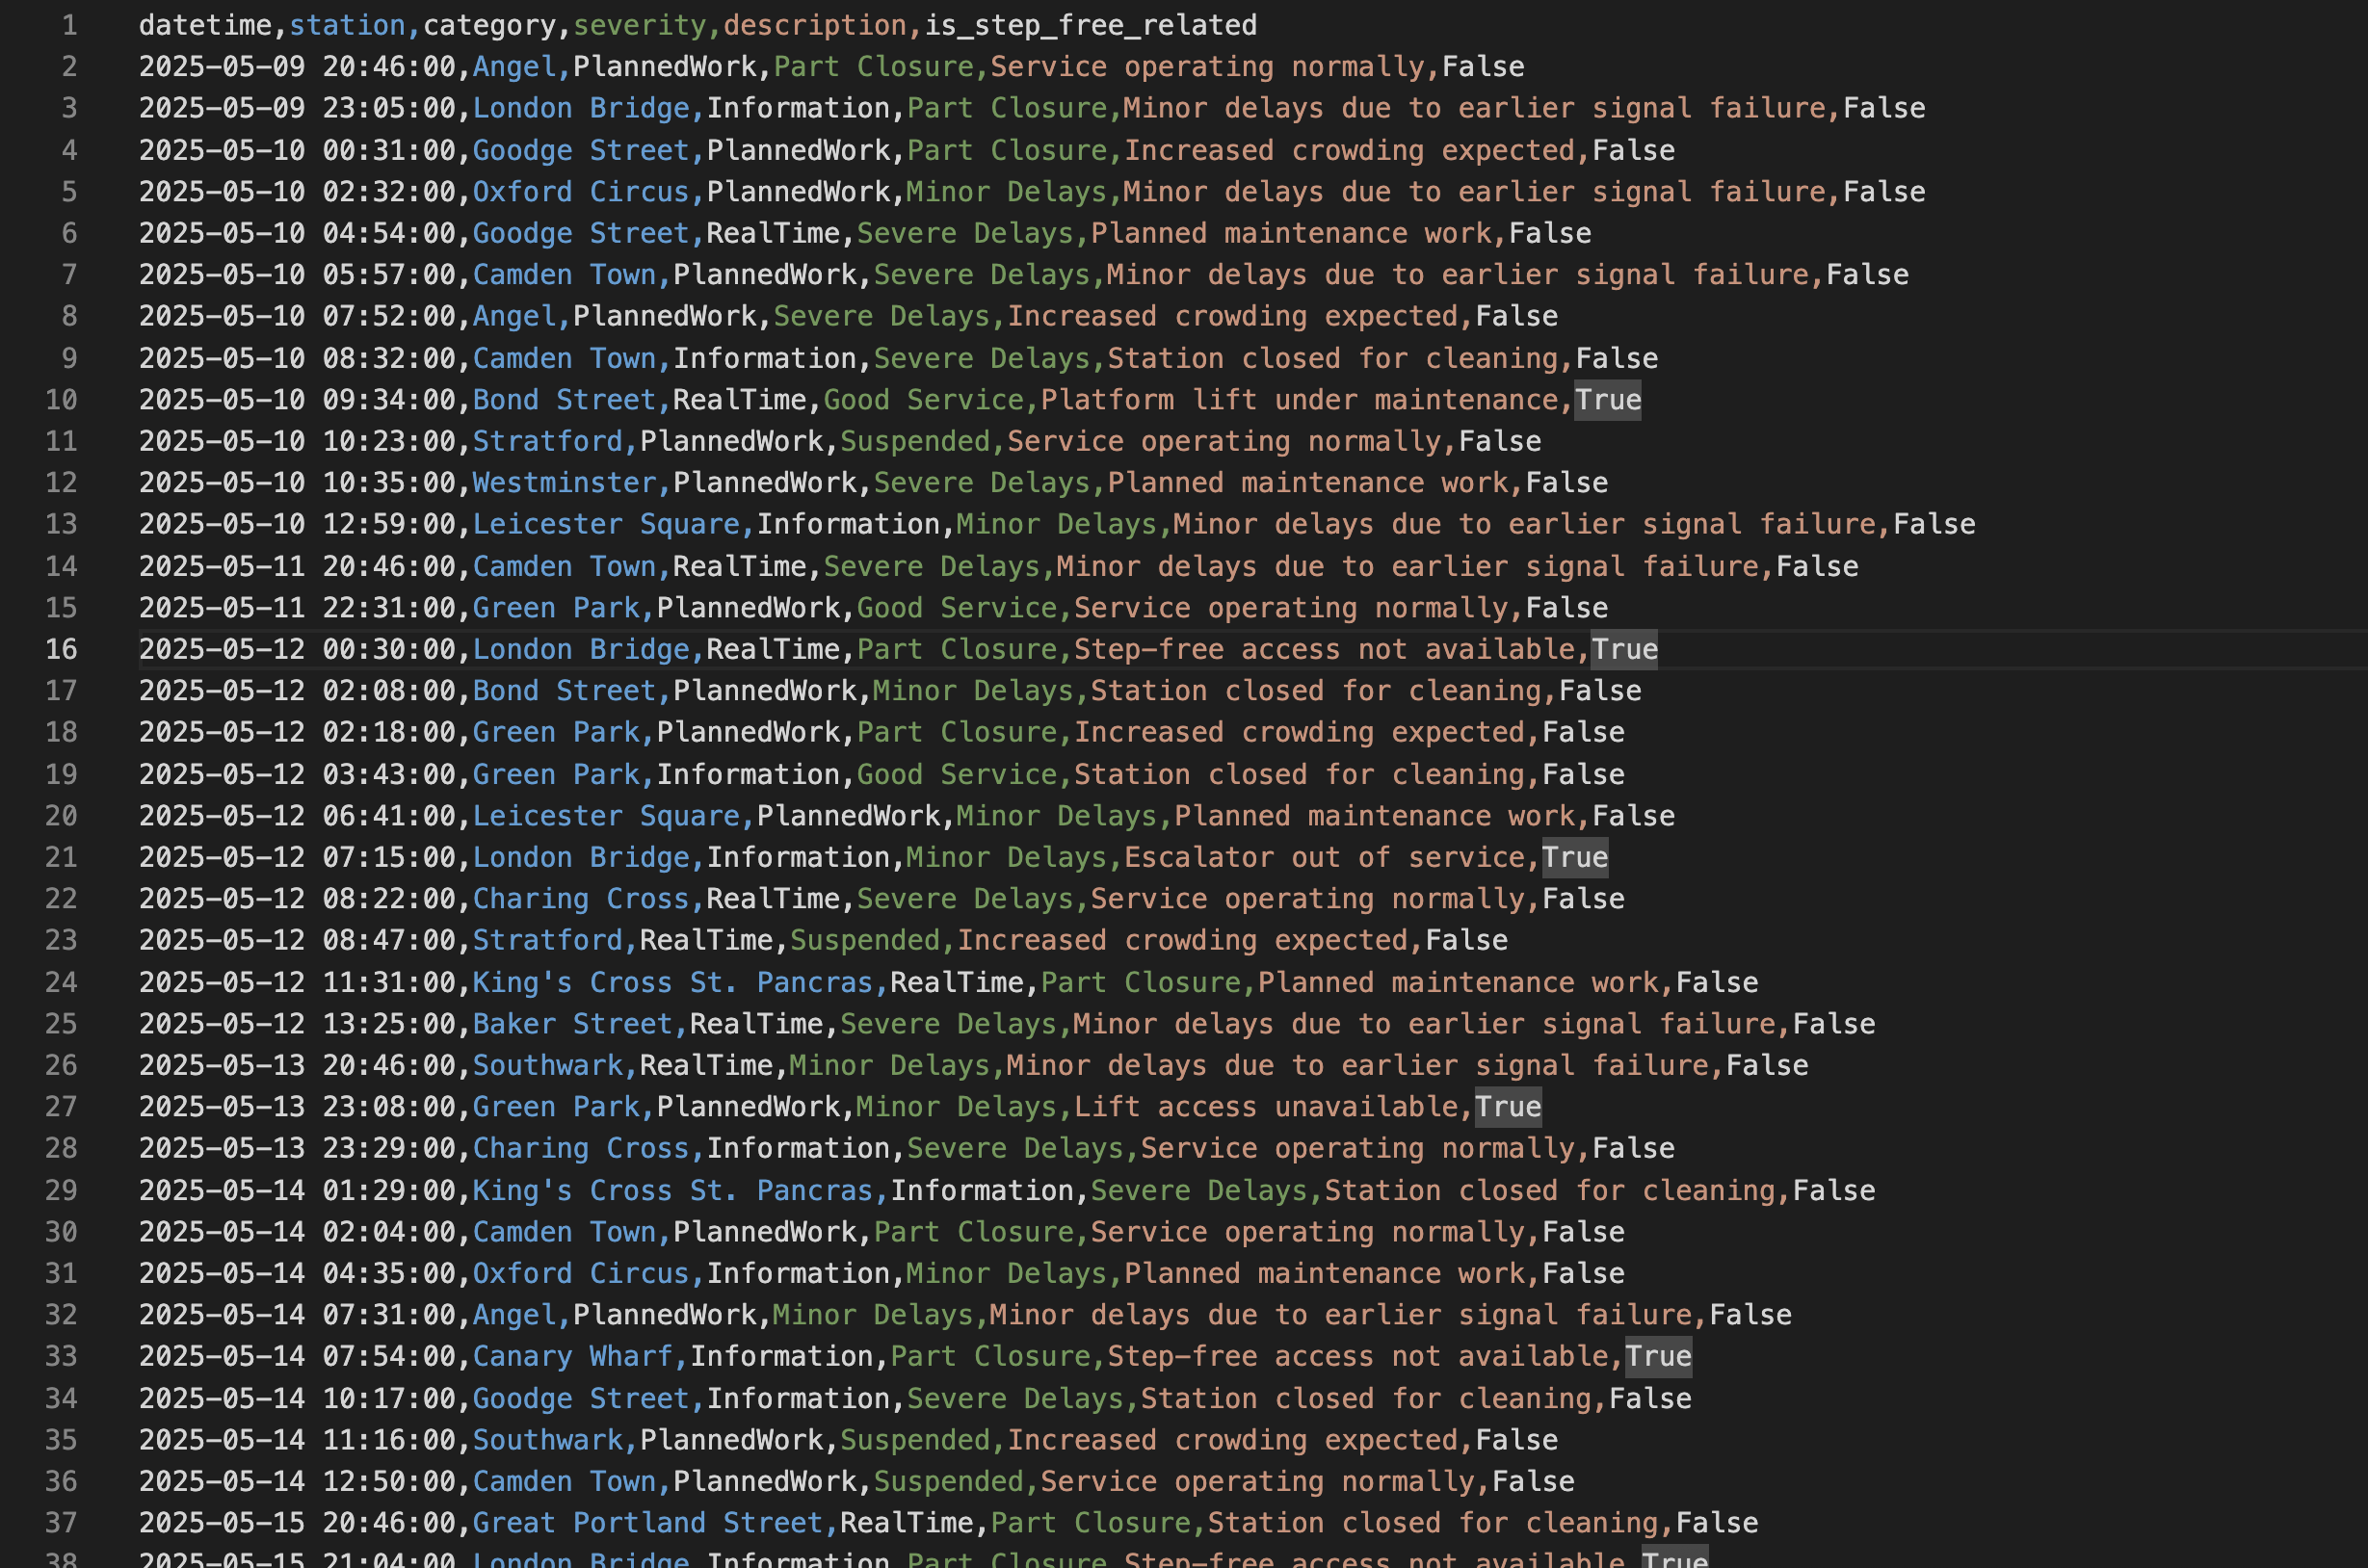
- Automating the collection of live data from the TfL Unified API
- Making real-time and historical insights available in one place
- Notifying users as soon as their station requires steps, and rapidly rerouting them
Technical Implementation
Tech Stack:
- Airflow: DAG scheduling and automation
- Streamlit: Interactive dashboard frontend
- Asyncio + REST APIs: Efficient data collection and backend services
- Pandas: Data processing and transformation
- PostgreSQL: Backend storage
Screenshots