Project Overview

This project visualises the long-term change in house prices across the United Kingdom using government-published price paid data from 1995 to 2024. The goal was to explore regional disparities in property value growth and present a geospatial heatmap to highlight patterns of affordability, demand, and investment hotspots.

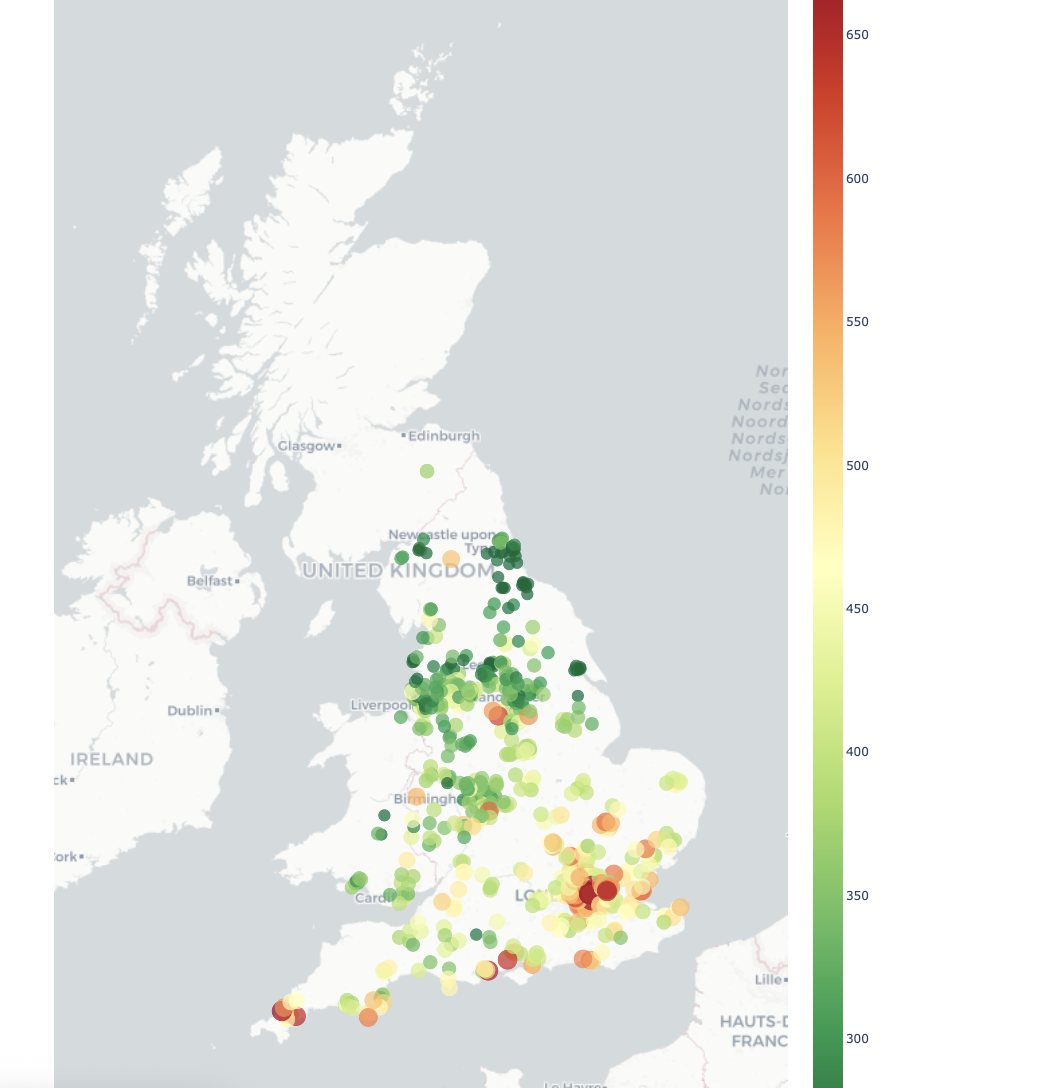
The final output is an interactive choropleth-style dot density map using Plotly and Mapbox, showing price change by postcode centroid, allowing a deeper understanding of how the housing market evolved across regions.

The Challenge

Key challenges included:

  • Massive dataset of over 10 million property transactions to clean and compress
  • Significant postcode and NUTS region mismatches required reconciliation
  • Outlier prices and rapid appreciation rates distorted trend clarity
  • Needed a colour gradient that accurately reflected percentage change without exaggerating urban spikes

Solution & Approach

  • Used Python and Pandas to clean, merge, and filter raw data from the UK Land Registry
  • Removed anomalies such as sales under £10,000 or over £10M to improve map readability
  • Mapped each property to its NUTS2 region using GeoPandas and postcode lookup tables
  • Calculated average price by year and region, then computed % change over the 29-year period
  • Used Plotly’s scatter_mapbox to generate a responsive UK-wide heatmap with scaled colourbars

Results

The implementation of this sales performance dashboard delivered significant business value:

10M+
Property Records Processed
1995-2024
Date Range Covered
650%
Max Localised Increase
370%+
UK Average Increqase
  • Highlighted South East hotspots and rural underperformance with clarity
  • Created the basis for a regional affordability index or price elasticity estimator
  • Useful for public policy, investment planning, and spatial inequality studies

Technical Implementation

The technical architecture was designed for scalability and reliability:

  • Language: Python
  • Libraries: Pandas, Plotly, GeoPandas, NumPy
  • Mapping: Plotly’s Mapbox visualisation with region-based filtering
  • Data Source: HM Land Registry Price Paid Dataset
  • Optimisation: Sampling + rolling averages to preserve performance

Output