Project Overview

This project was self built and features an interactive dashboard to simulate and visualise real time e-commerce user progress through a conversion funnel. I aimed to provide a viewpoint of customer behaviour across each stage to help identify repeating drop-off points and opportunities for optimisation.

The project utilises data simulations, an ETL pipeline, and real-time analytics to showcase a business use-case of the funnel.

The Challenge

Whilst working on previous e-commerce sites, it became evident that businesses face challenges in understanding and improving conversion rates. Without any kind of real-time visibility, it becomes challenging to:

  • Detect sudden drop-offs in the funnel
  • Better understand customer behaviour across pages
  • Quickly improve the site to reduce abandonment
  • Filter out noisy traffic that makes analyses challenging

Since I didn't have a live site to deploy the programme to; simulating a live funnel was an obstacle but was neccessary to reliably deploy a fully functioning solution.

Solution & Approach

The end-to-end solution involved:

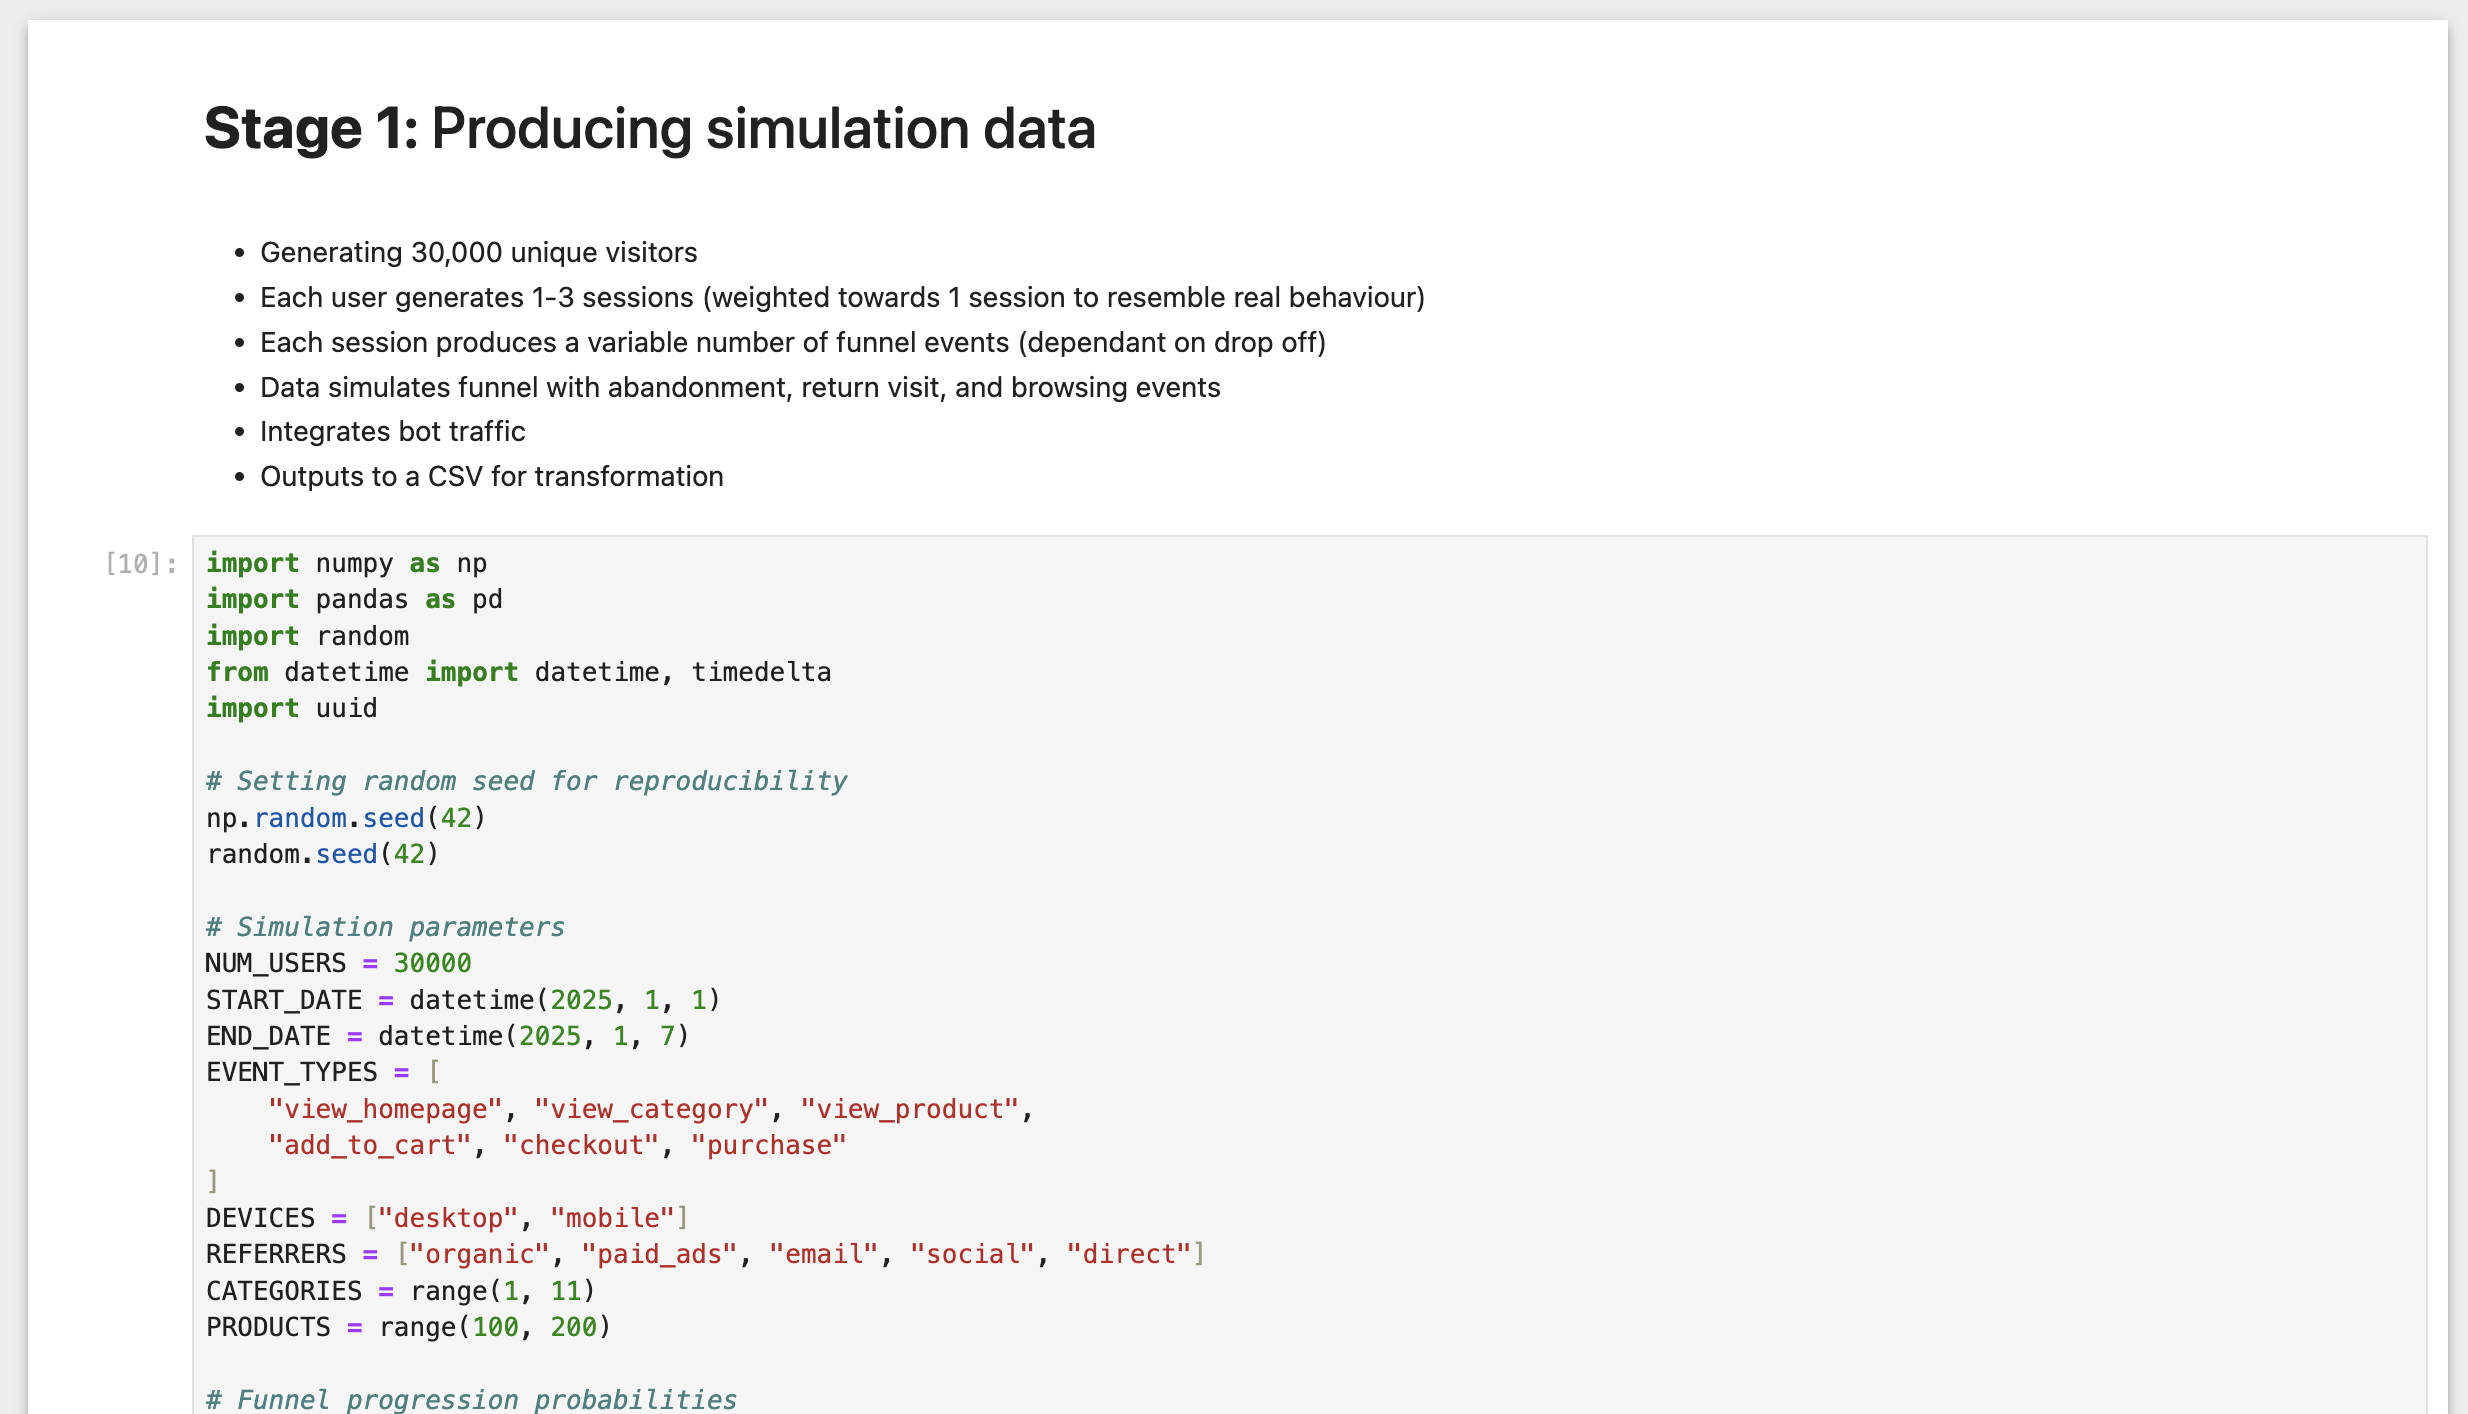
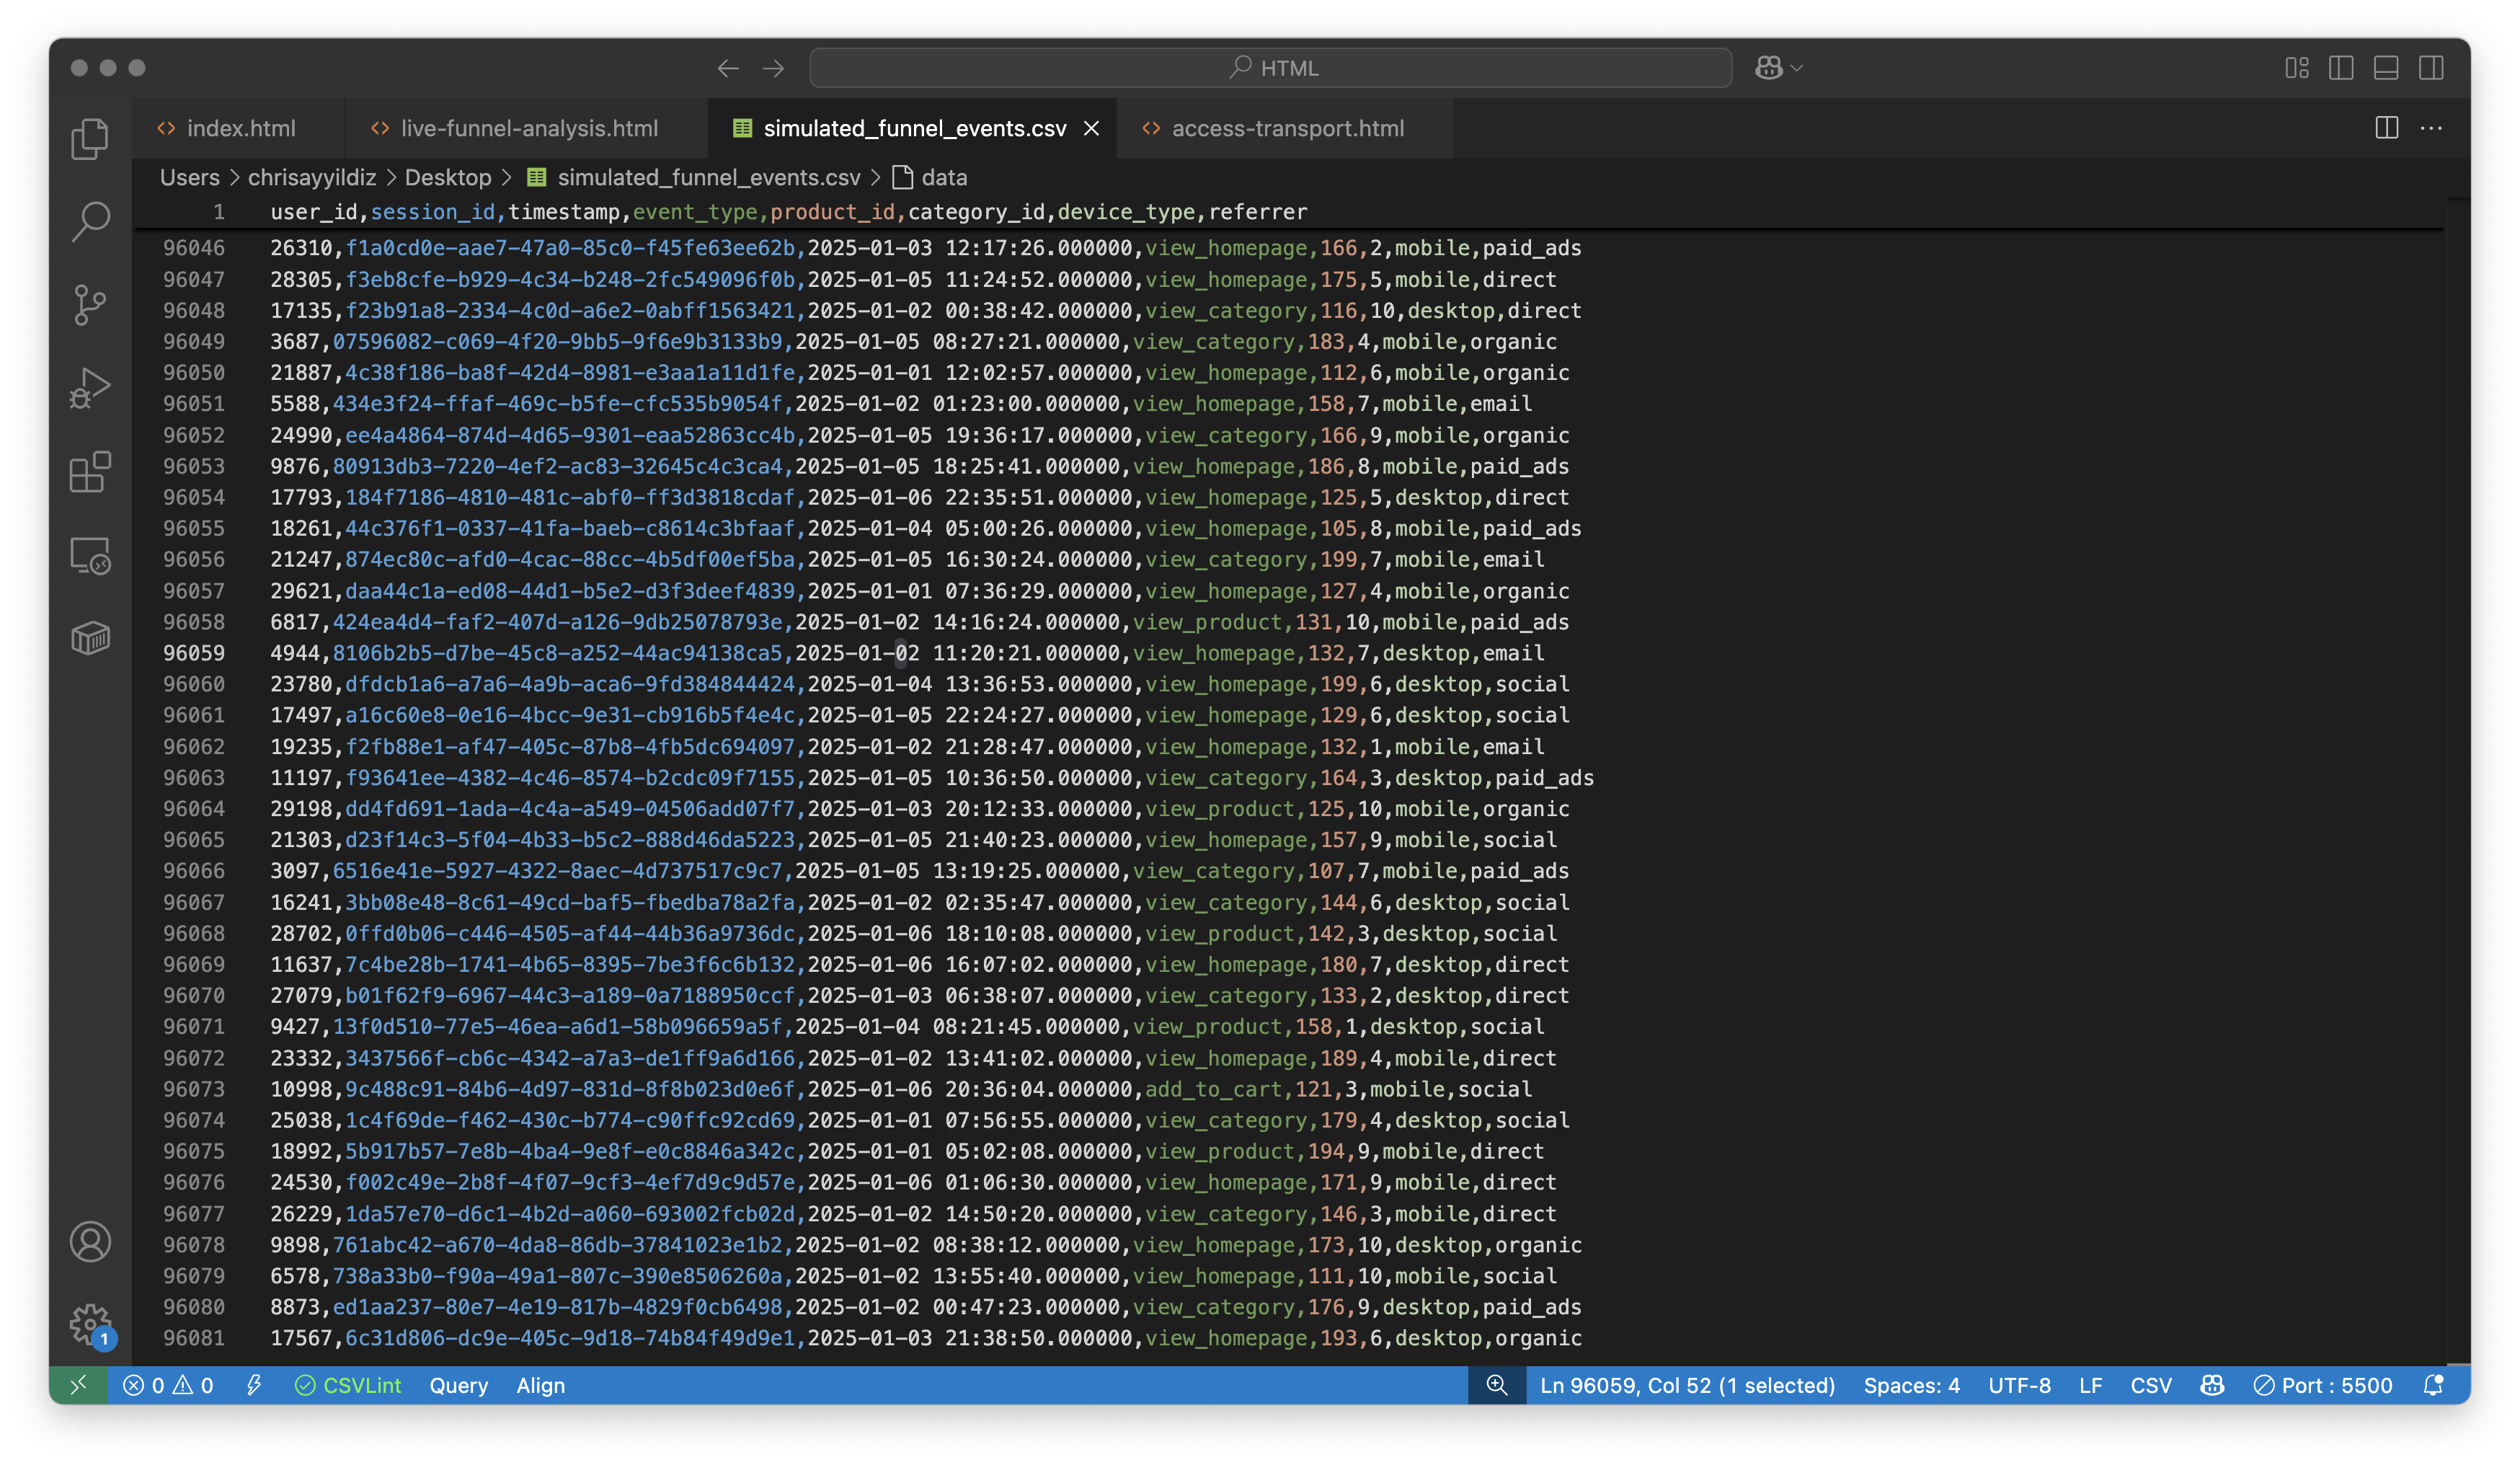
  • Data Simulation: Generating 30,000 unique users with session data over a simulated week
  • Noise and Anomalies: With variable drop-off rates and a simulated checkout error causing a spike in abandonment (useful for testing)
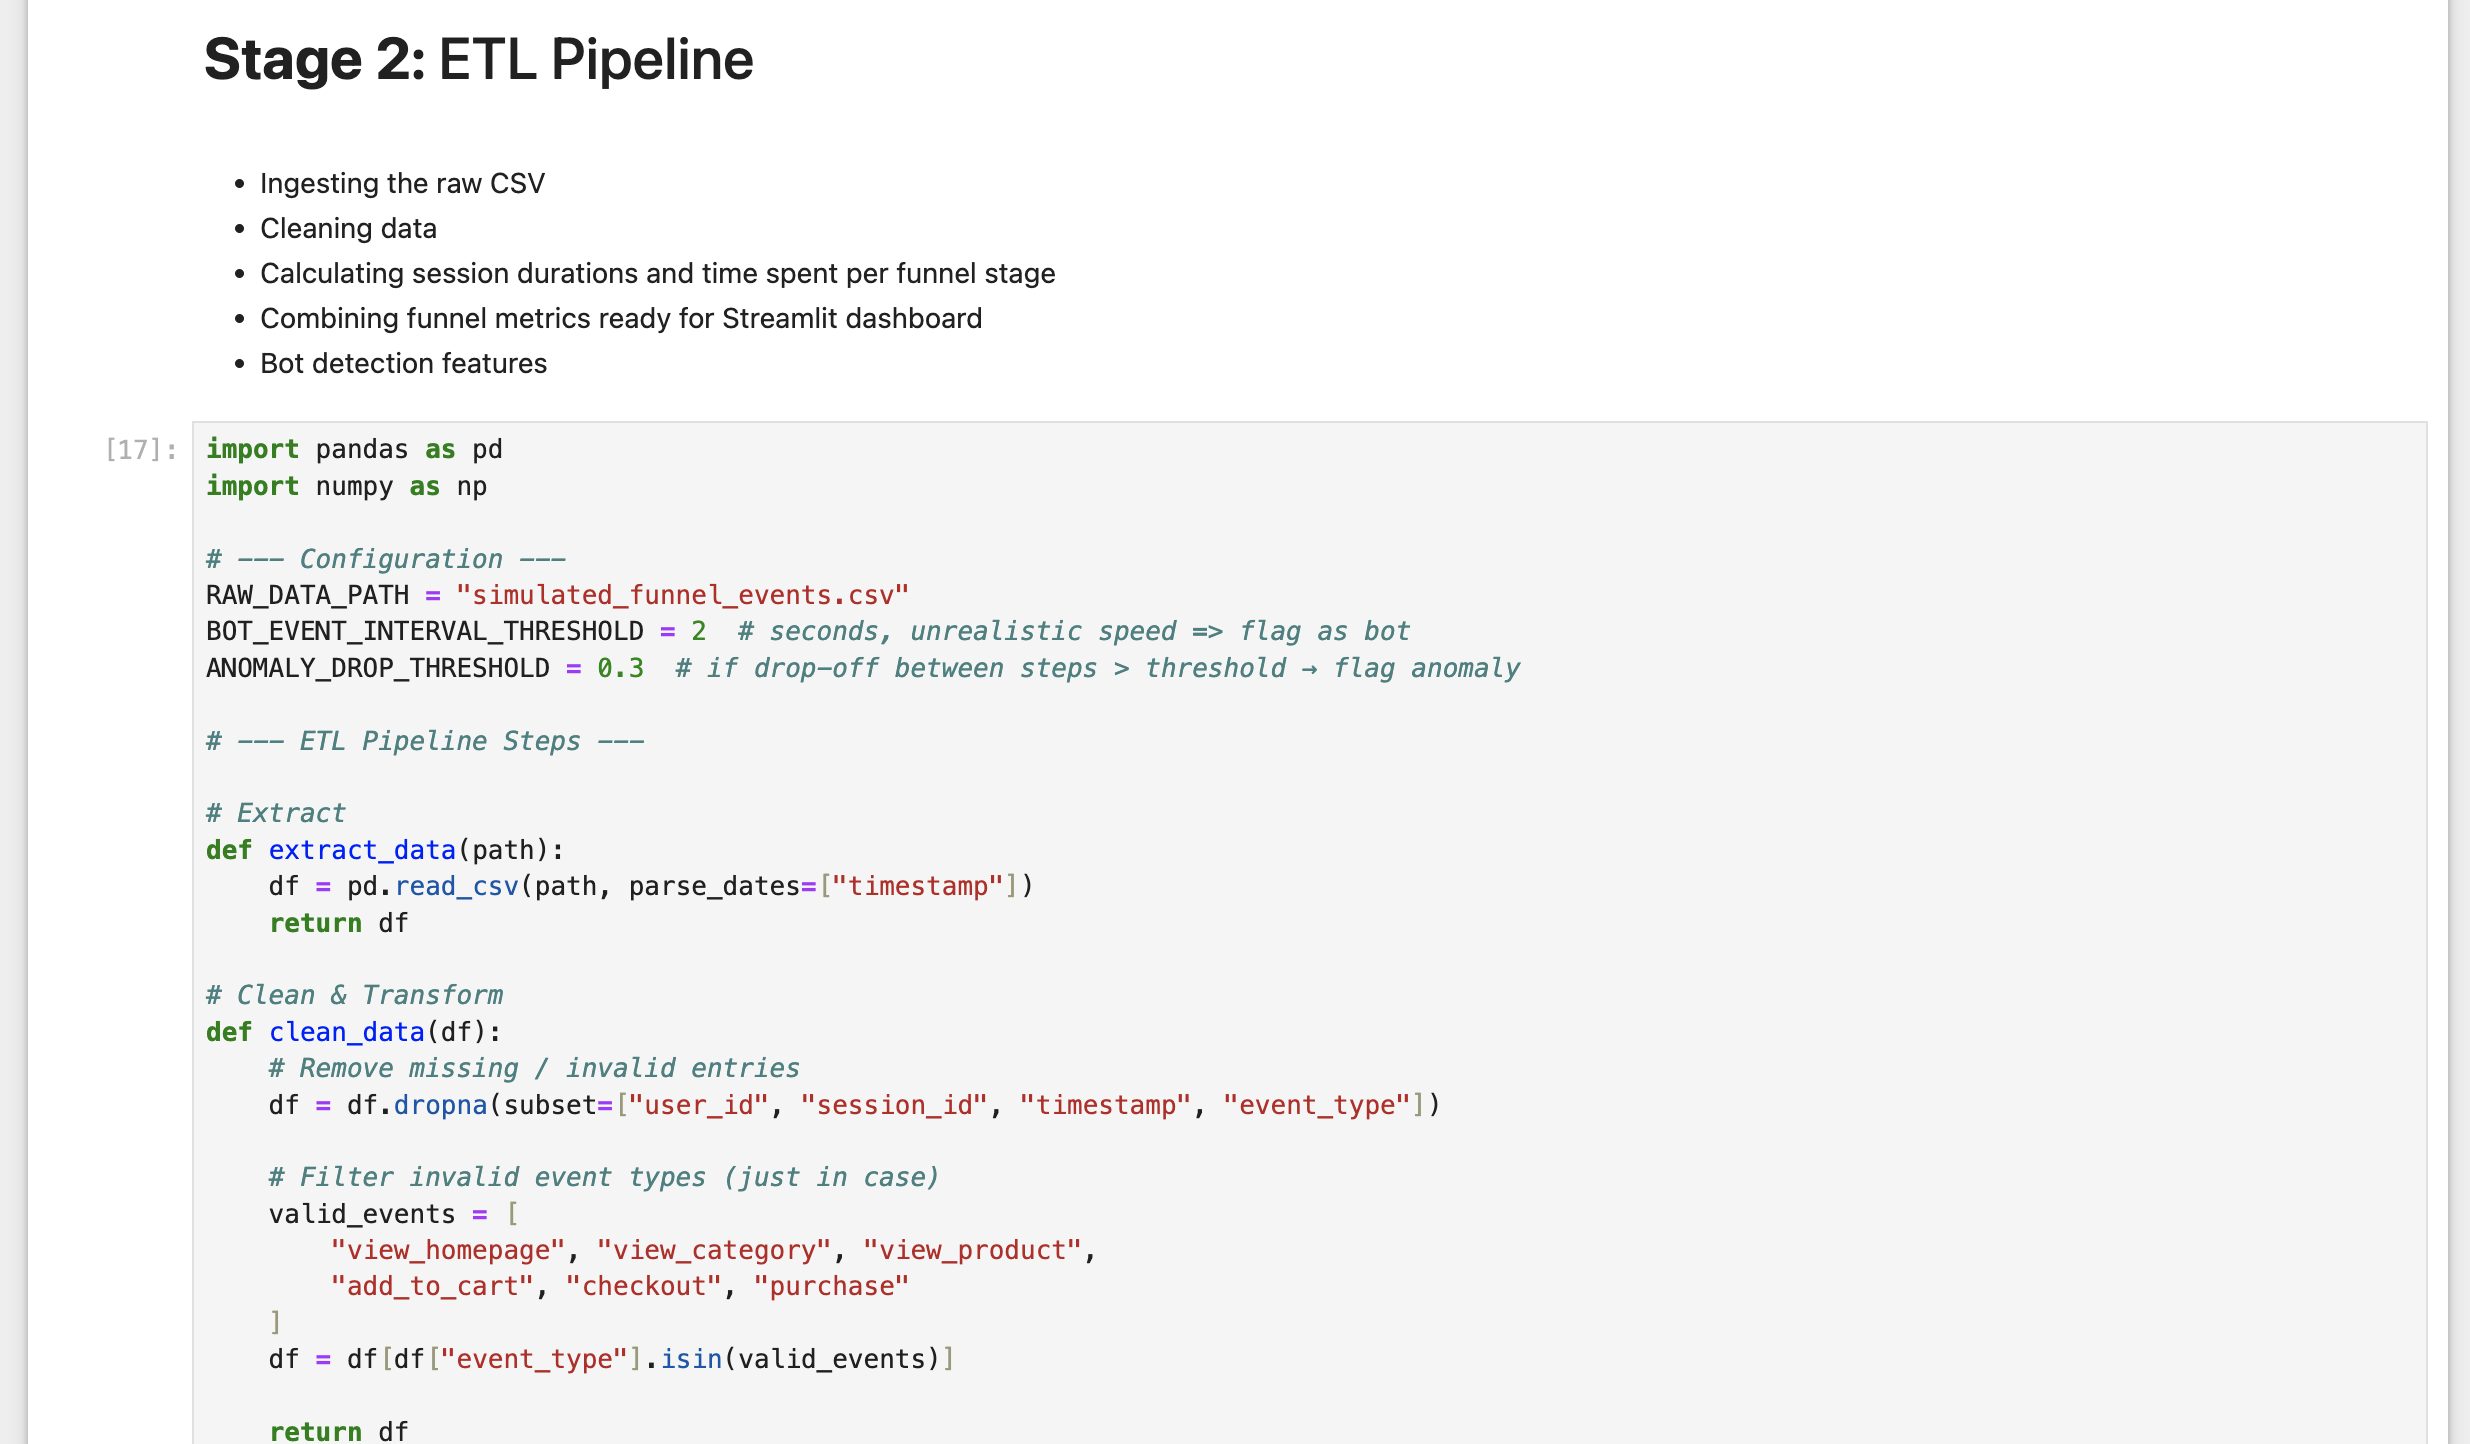
  • Data Processing (& ETL): Extracted raw data from a CSV, transformed in Pandas, and loaded into a DataFrame for interactive Streamlit visualisation
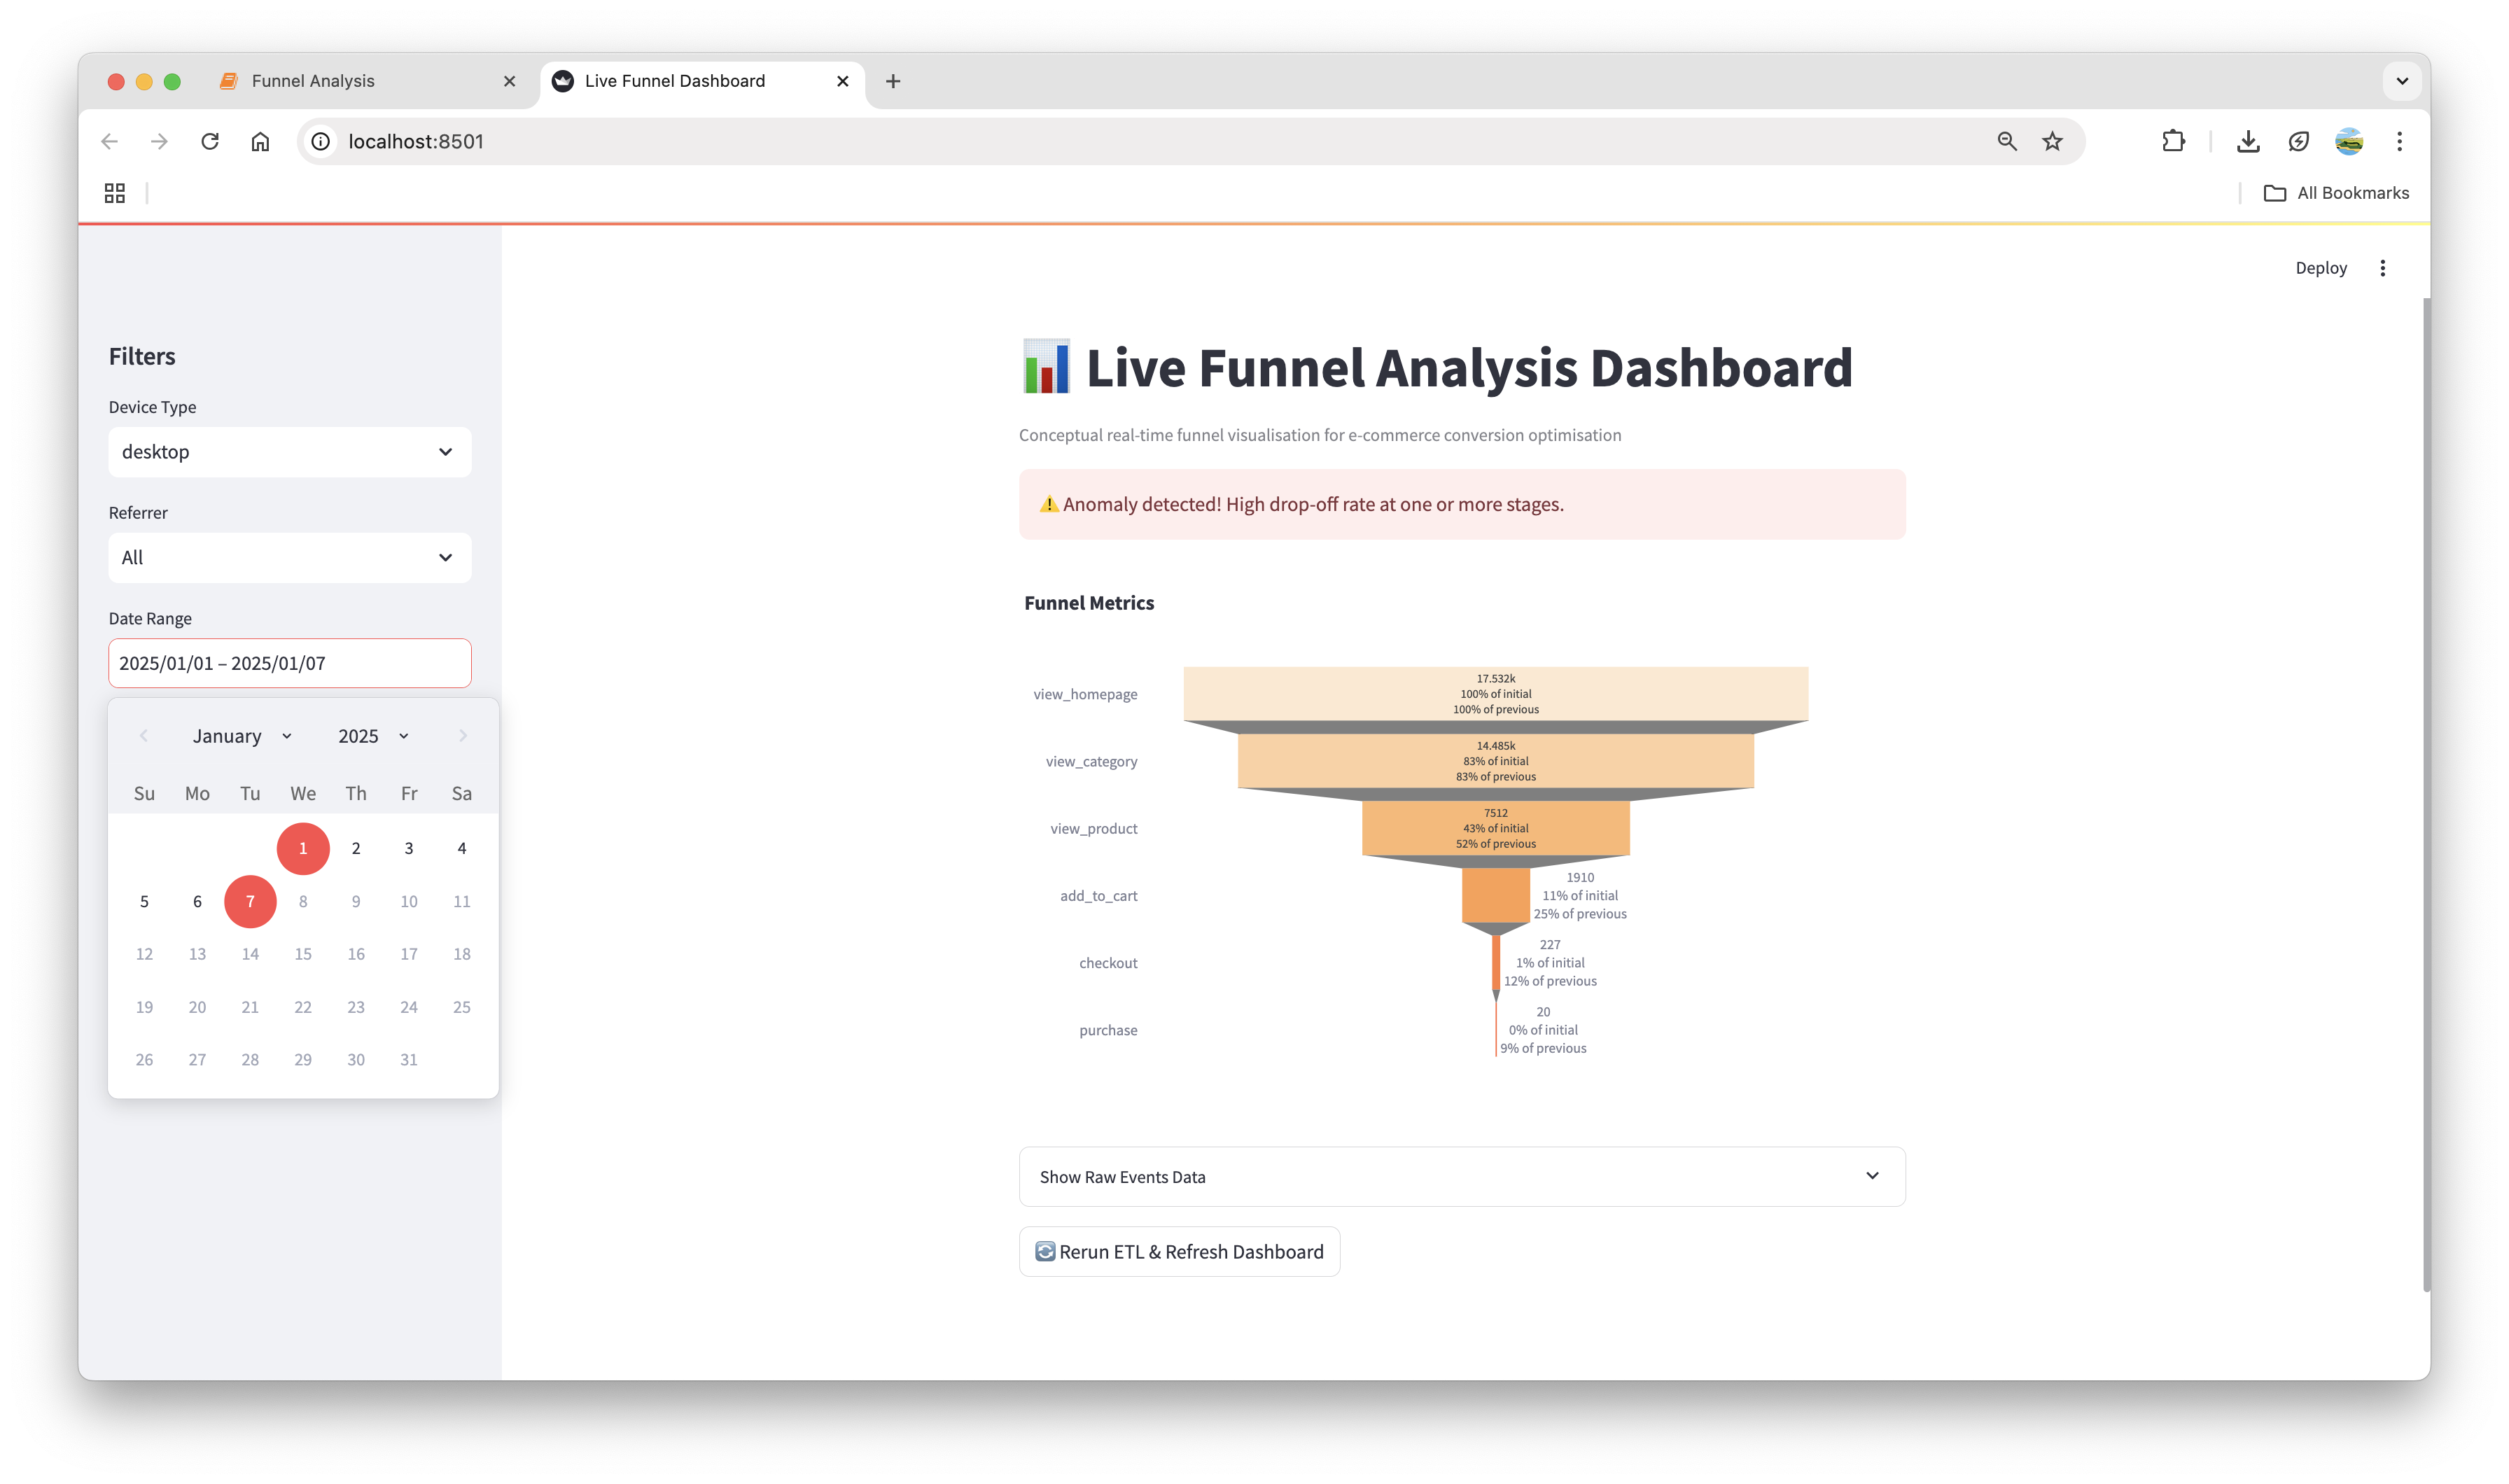
  • Interactive Dashboard: Visualised a funnel chart showing user flow and drop-offs with time-range selectors, fully deployed to the cloud

Results

Several findings where observed when analysing the dashboard:

0.13%
Observed Conversion
582
Bots Detected
91.4%
Highest Drop Off Rate
30K
Users

Dashboard Screenshots