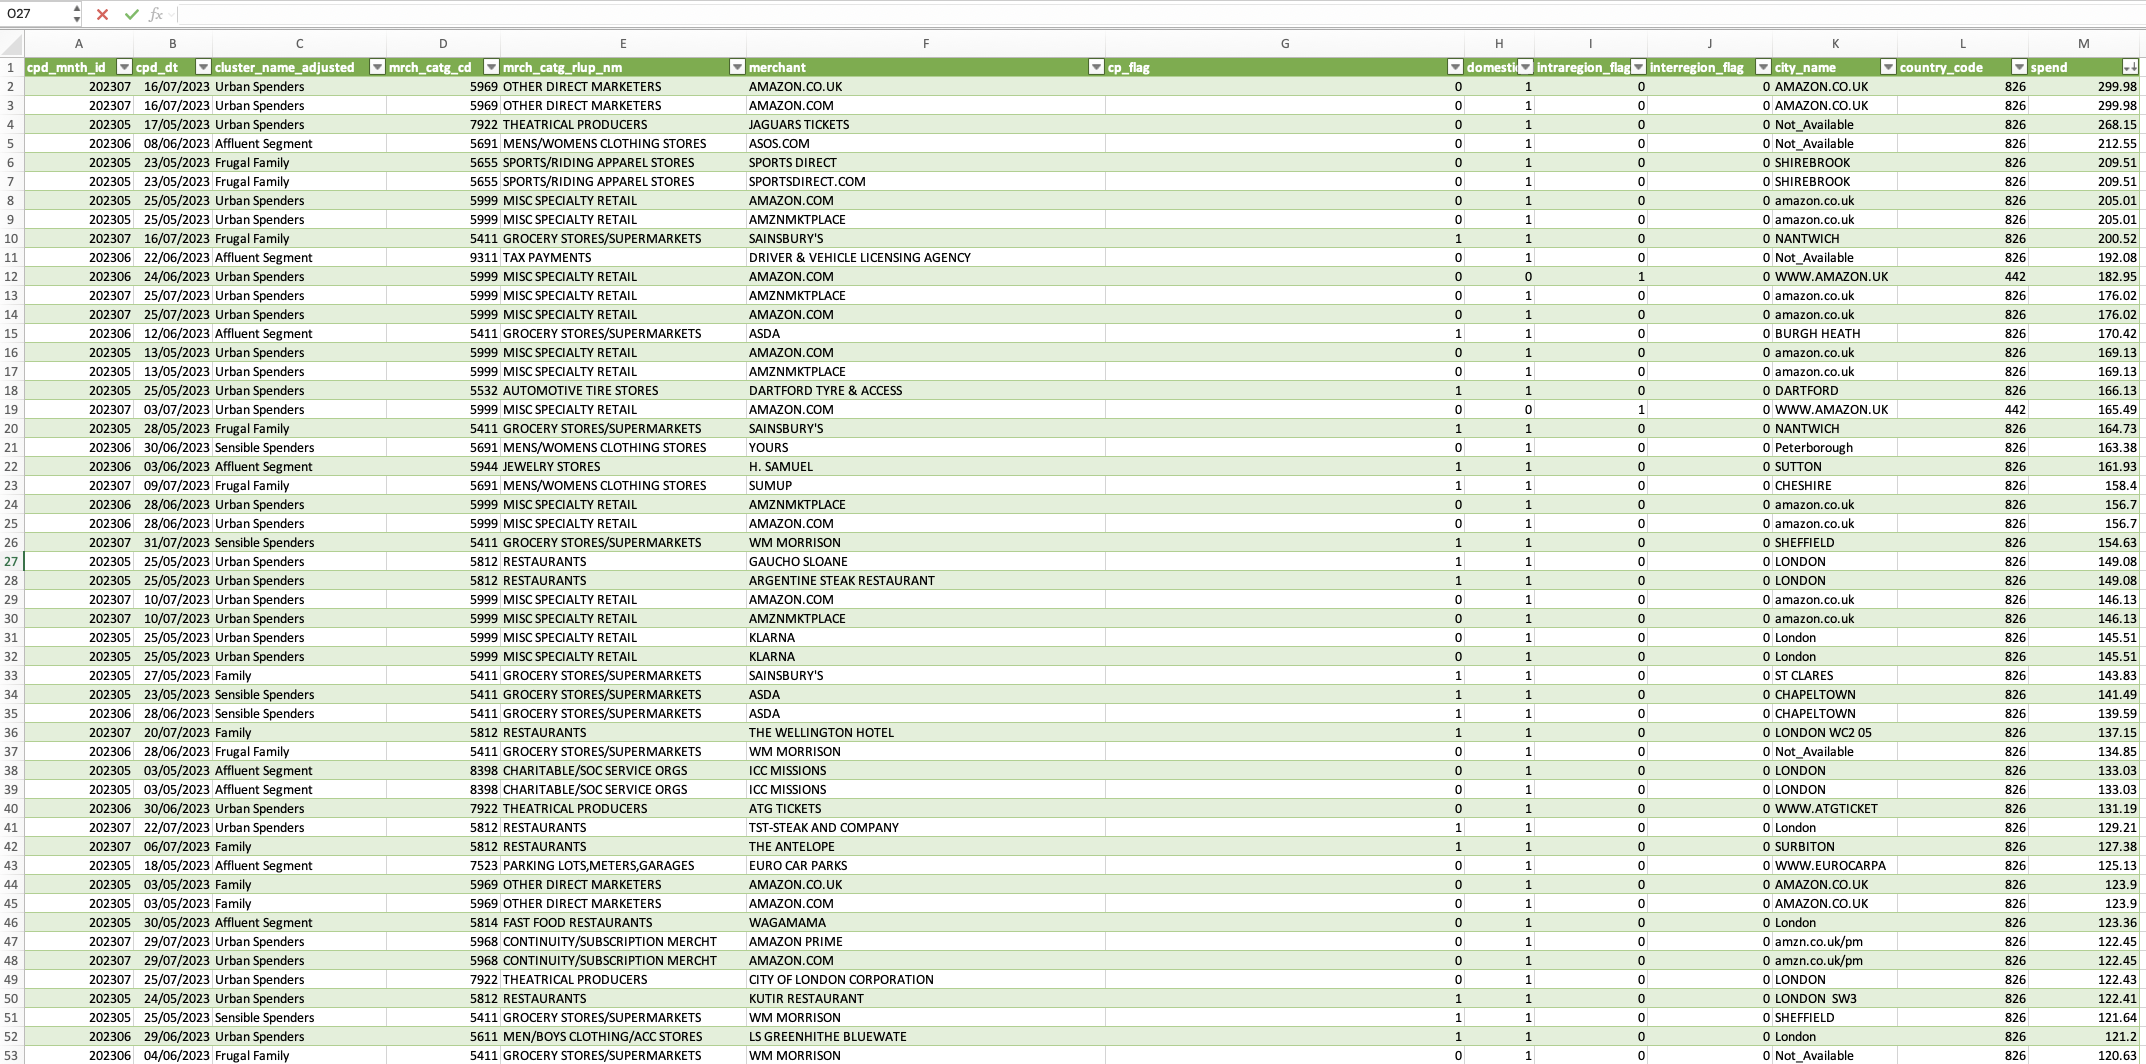
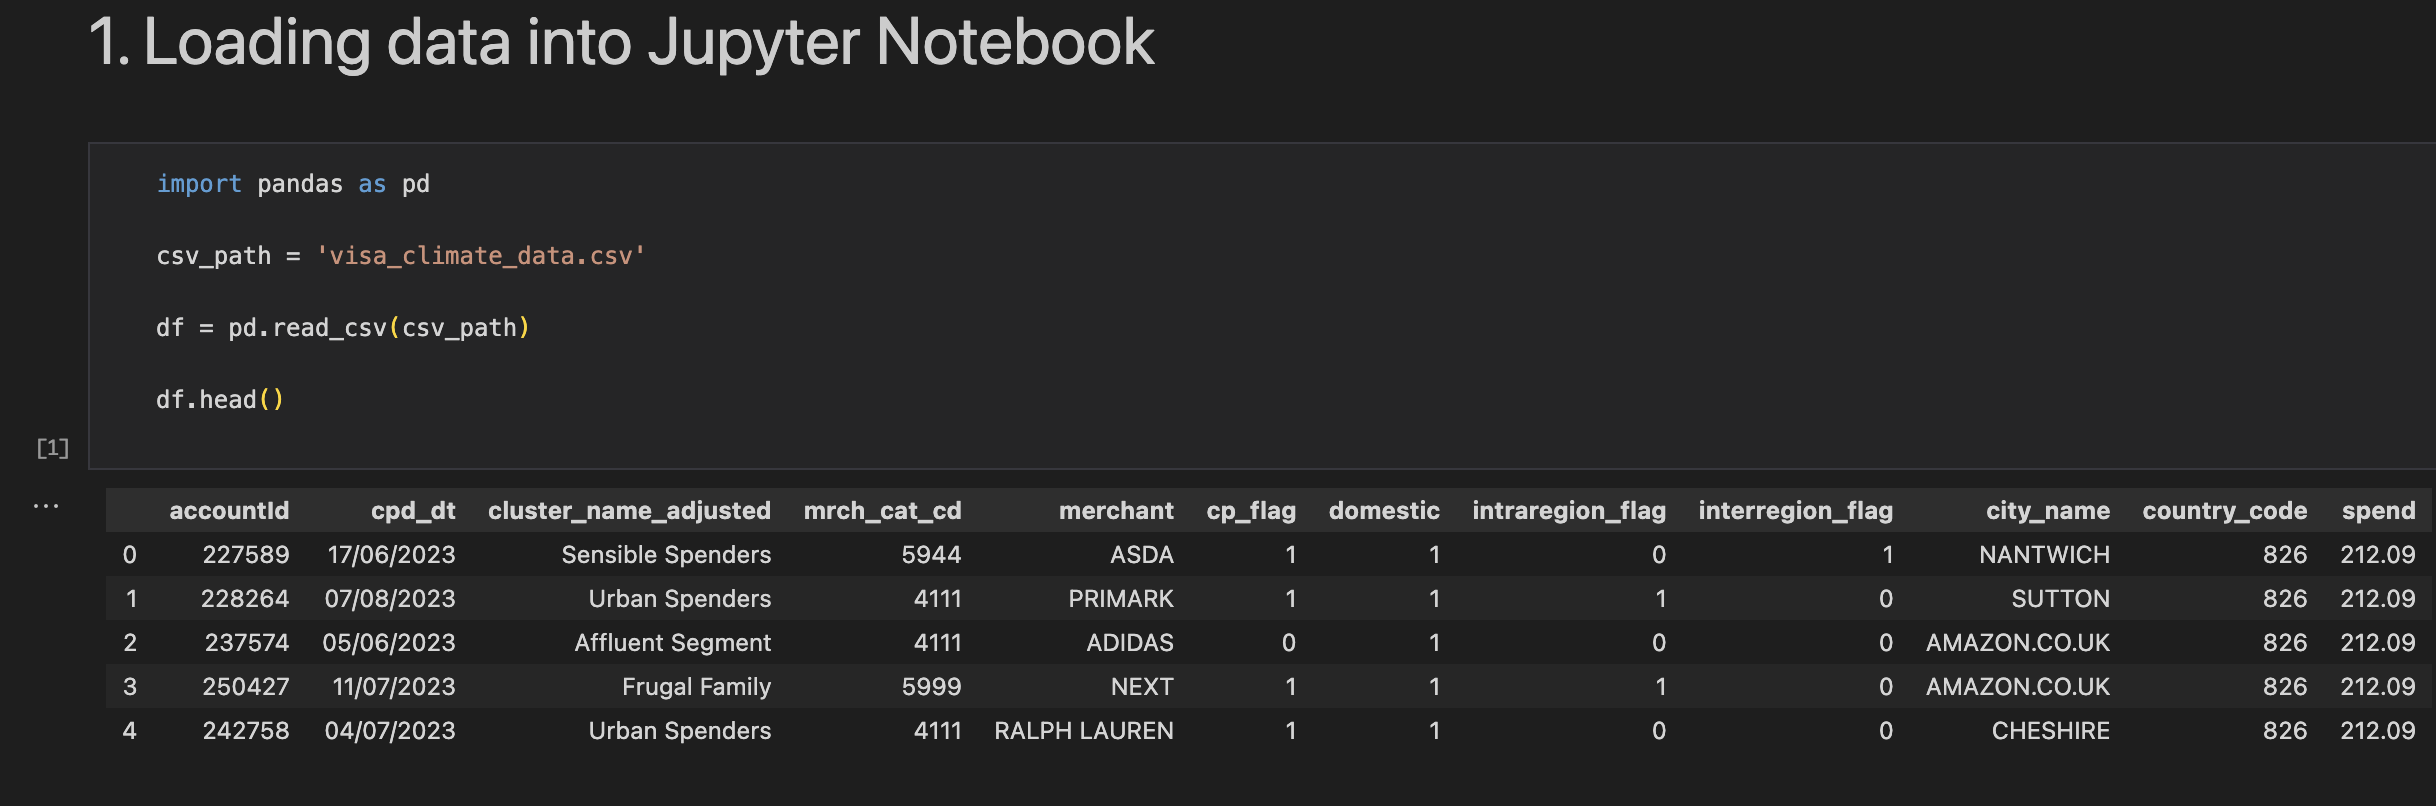
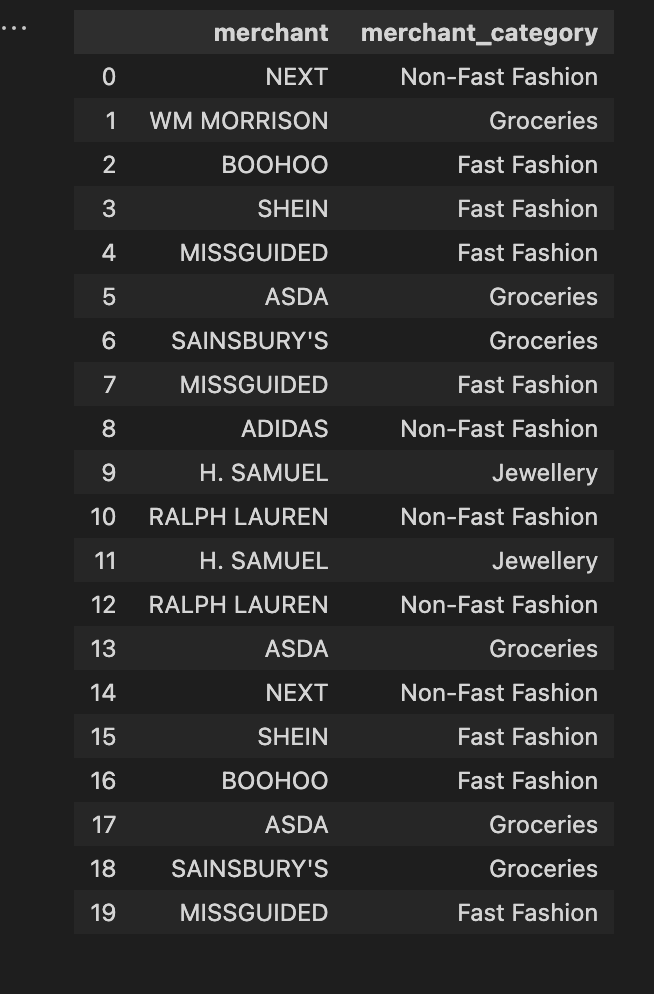
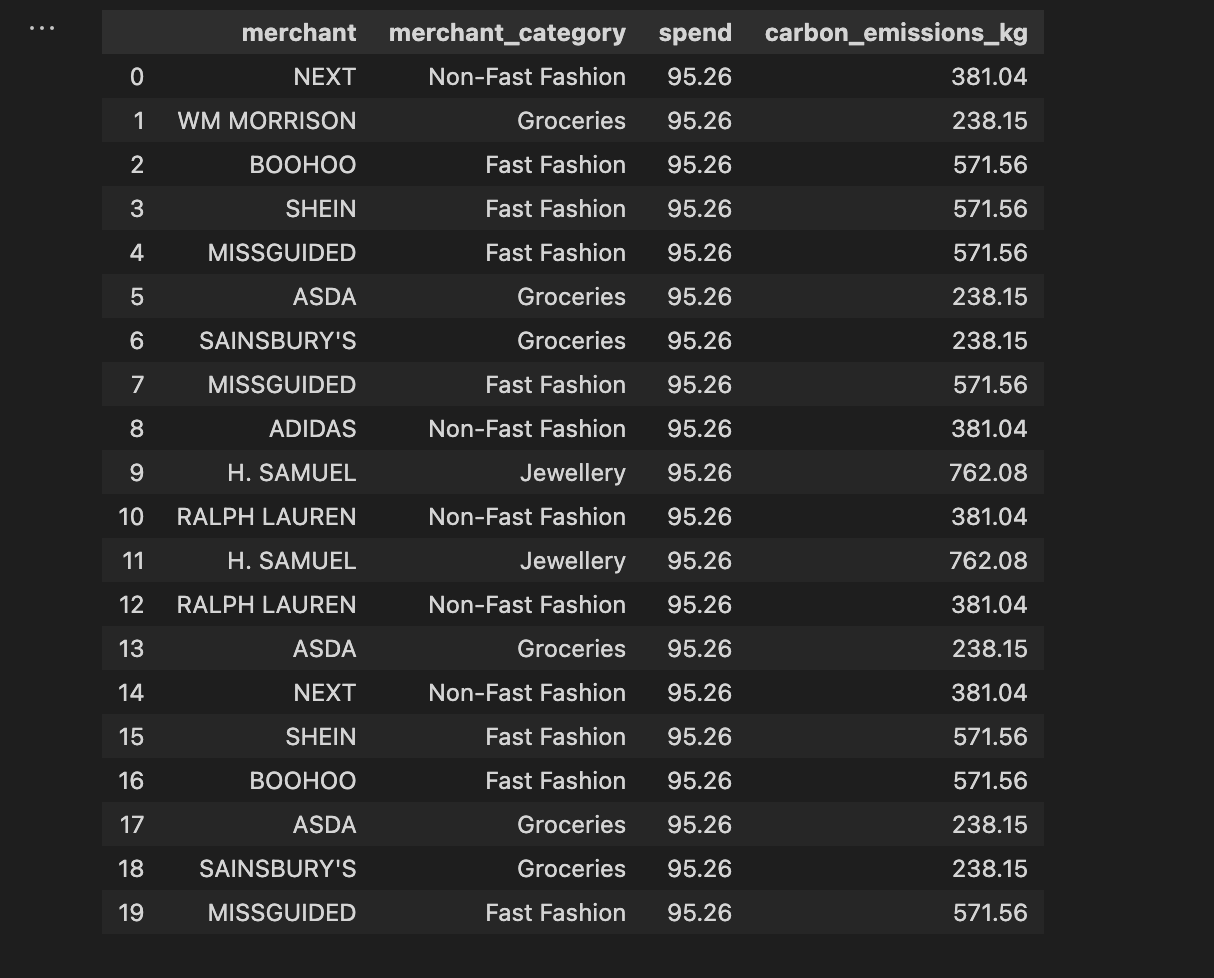
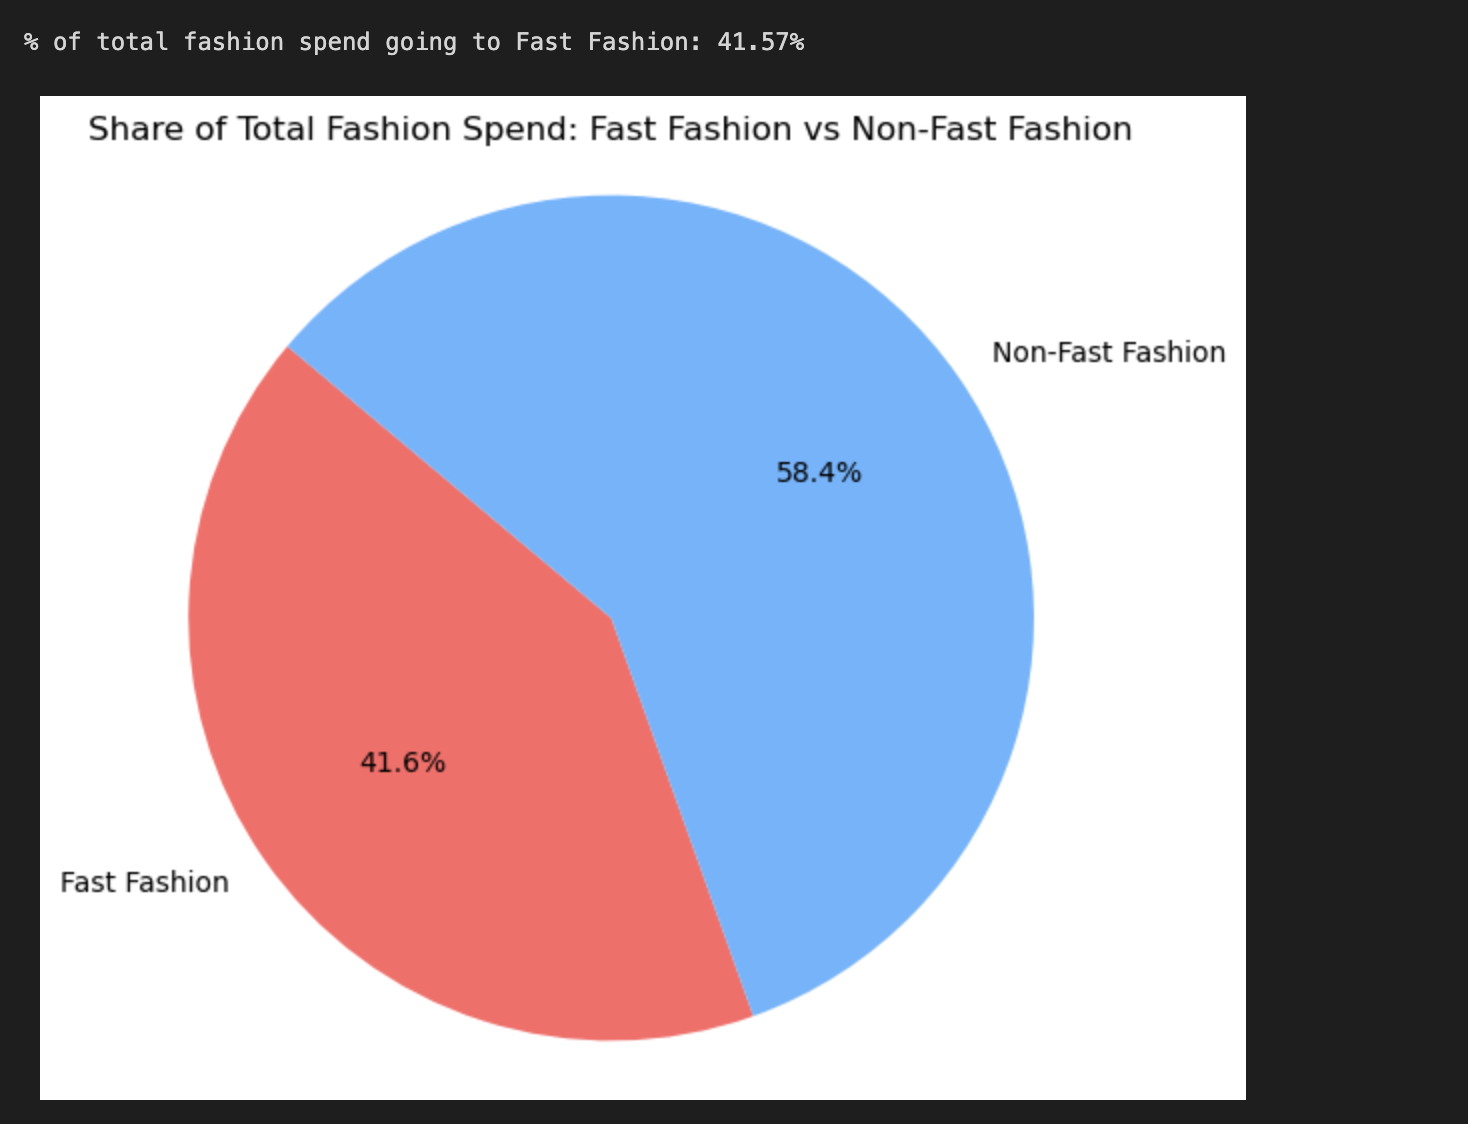
Working with the data, I generated a few different visualisations. Firstly, I looked at the percentage of total fashion spend going to wards non-fast and fast fashion purchases. This identified that 41.6% of purchases in this category were fast fashion (including merchants like Shein, Primark, Boohoo, Missguided, and PrettyLittleThing).
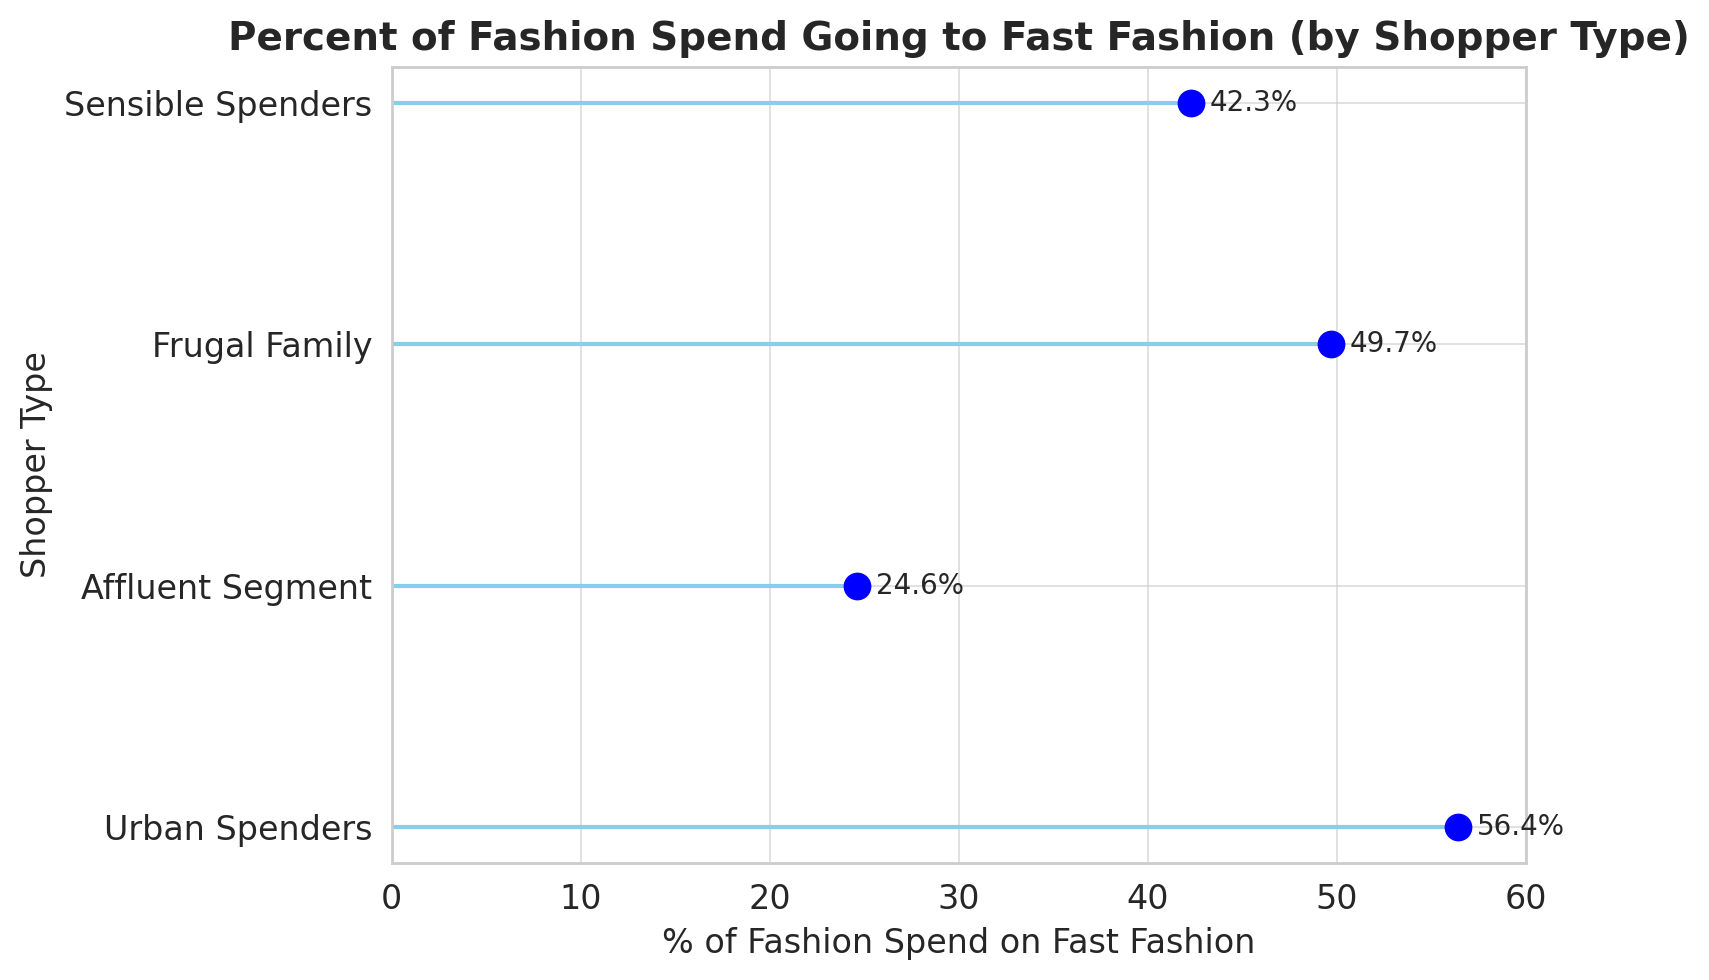
From here, I utilised a pre-existing field provided by Visa which determined the ‘shopper type’ of each transaction, grouping consumers into four categories: urban spenders, affluent segment, frugal family, and sensible spenders. This offered an insight into how trends differed across these categories. The output of this can be viewed below.
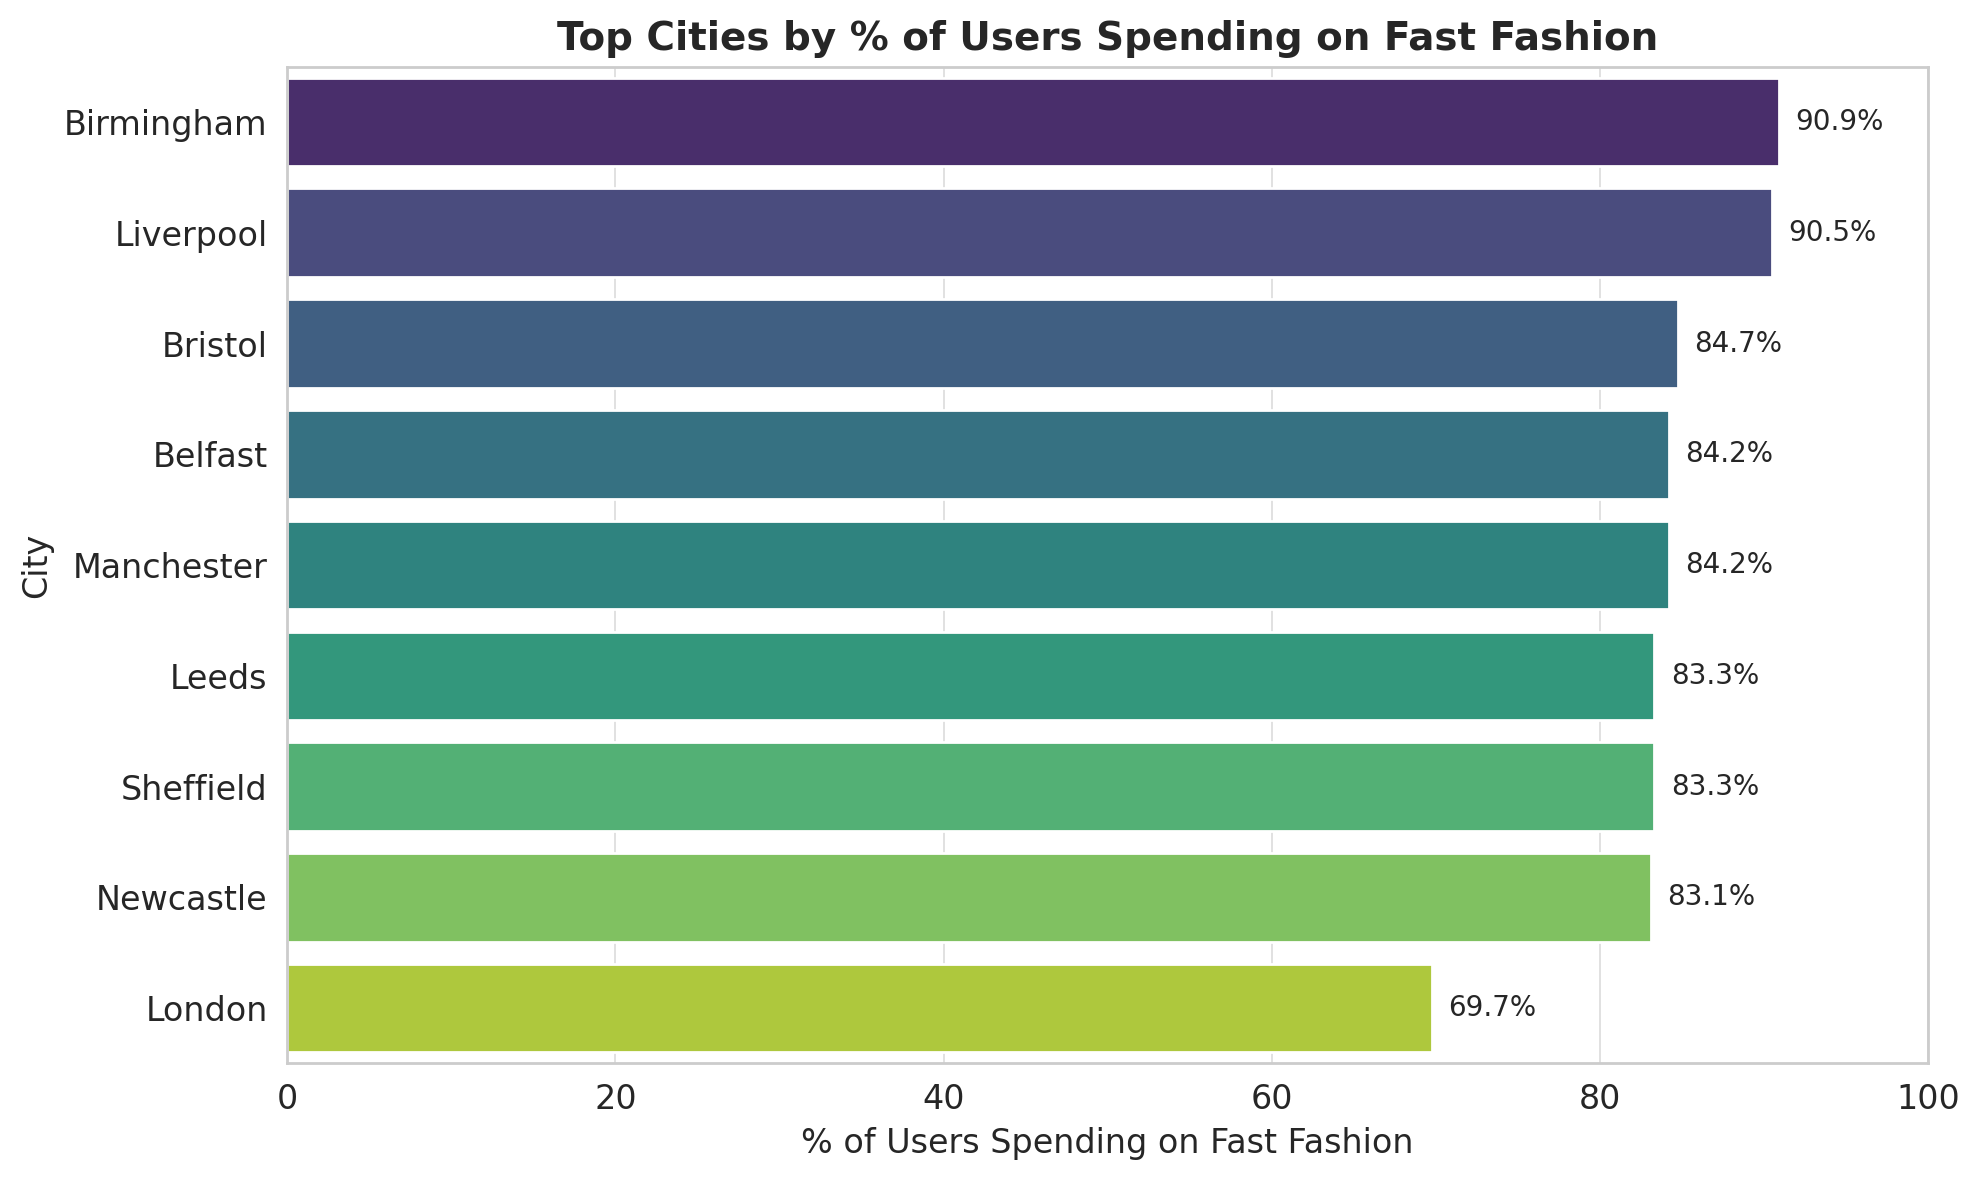
Lastly, I wanted to explore how these purchasing rates varied across UK regions. I mapped this to a horizontal bar chart with gradient colouring to make it easier to interpret.
Together, these outputs provided clear insights suggesting that consumers based outside of London from the sample generally spent more on fast fashion than those spending in the city. Furthermore, areas like Liverpool and Birmingham saw the highest rates of fast fashion spending. Looking at shopper types, urban spenders saw the highest percentage of their fashion spend going towards fast-fashion, with the affluent segment predictably spending less than half of this rate on the merchant category. Frugal families were the second highest spending rate on fast fashion items which might align with the relatively cheaper cost of these goods compared to longer-lasting but more expensive alternatives.