Project Overview

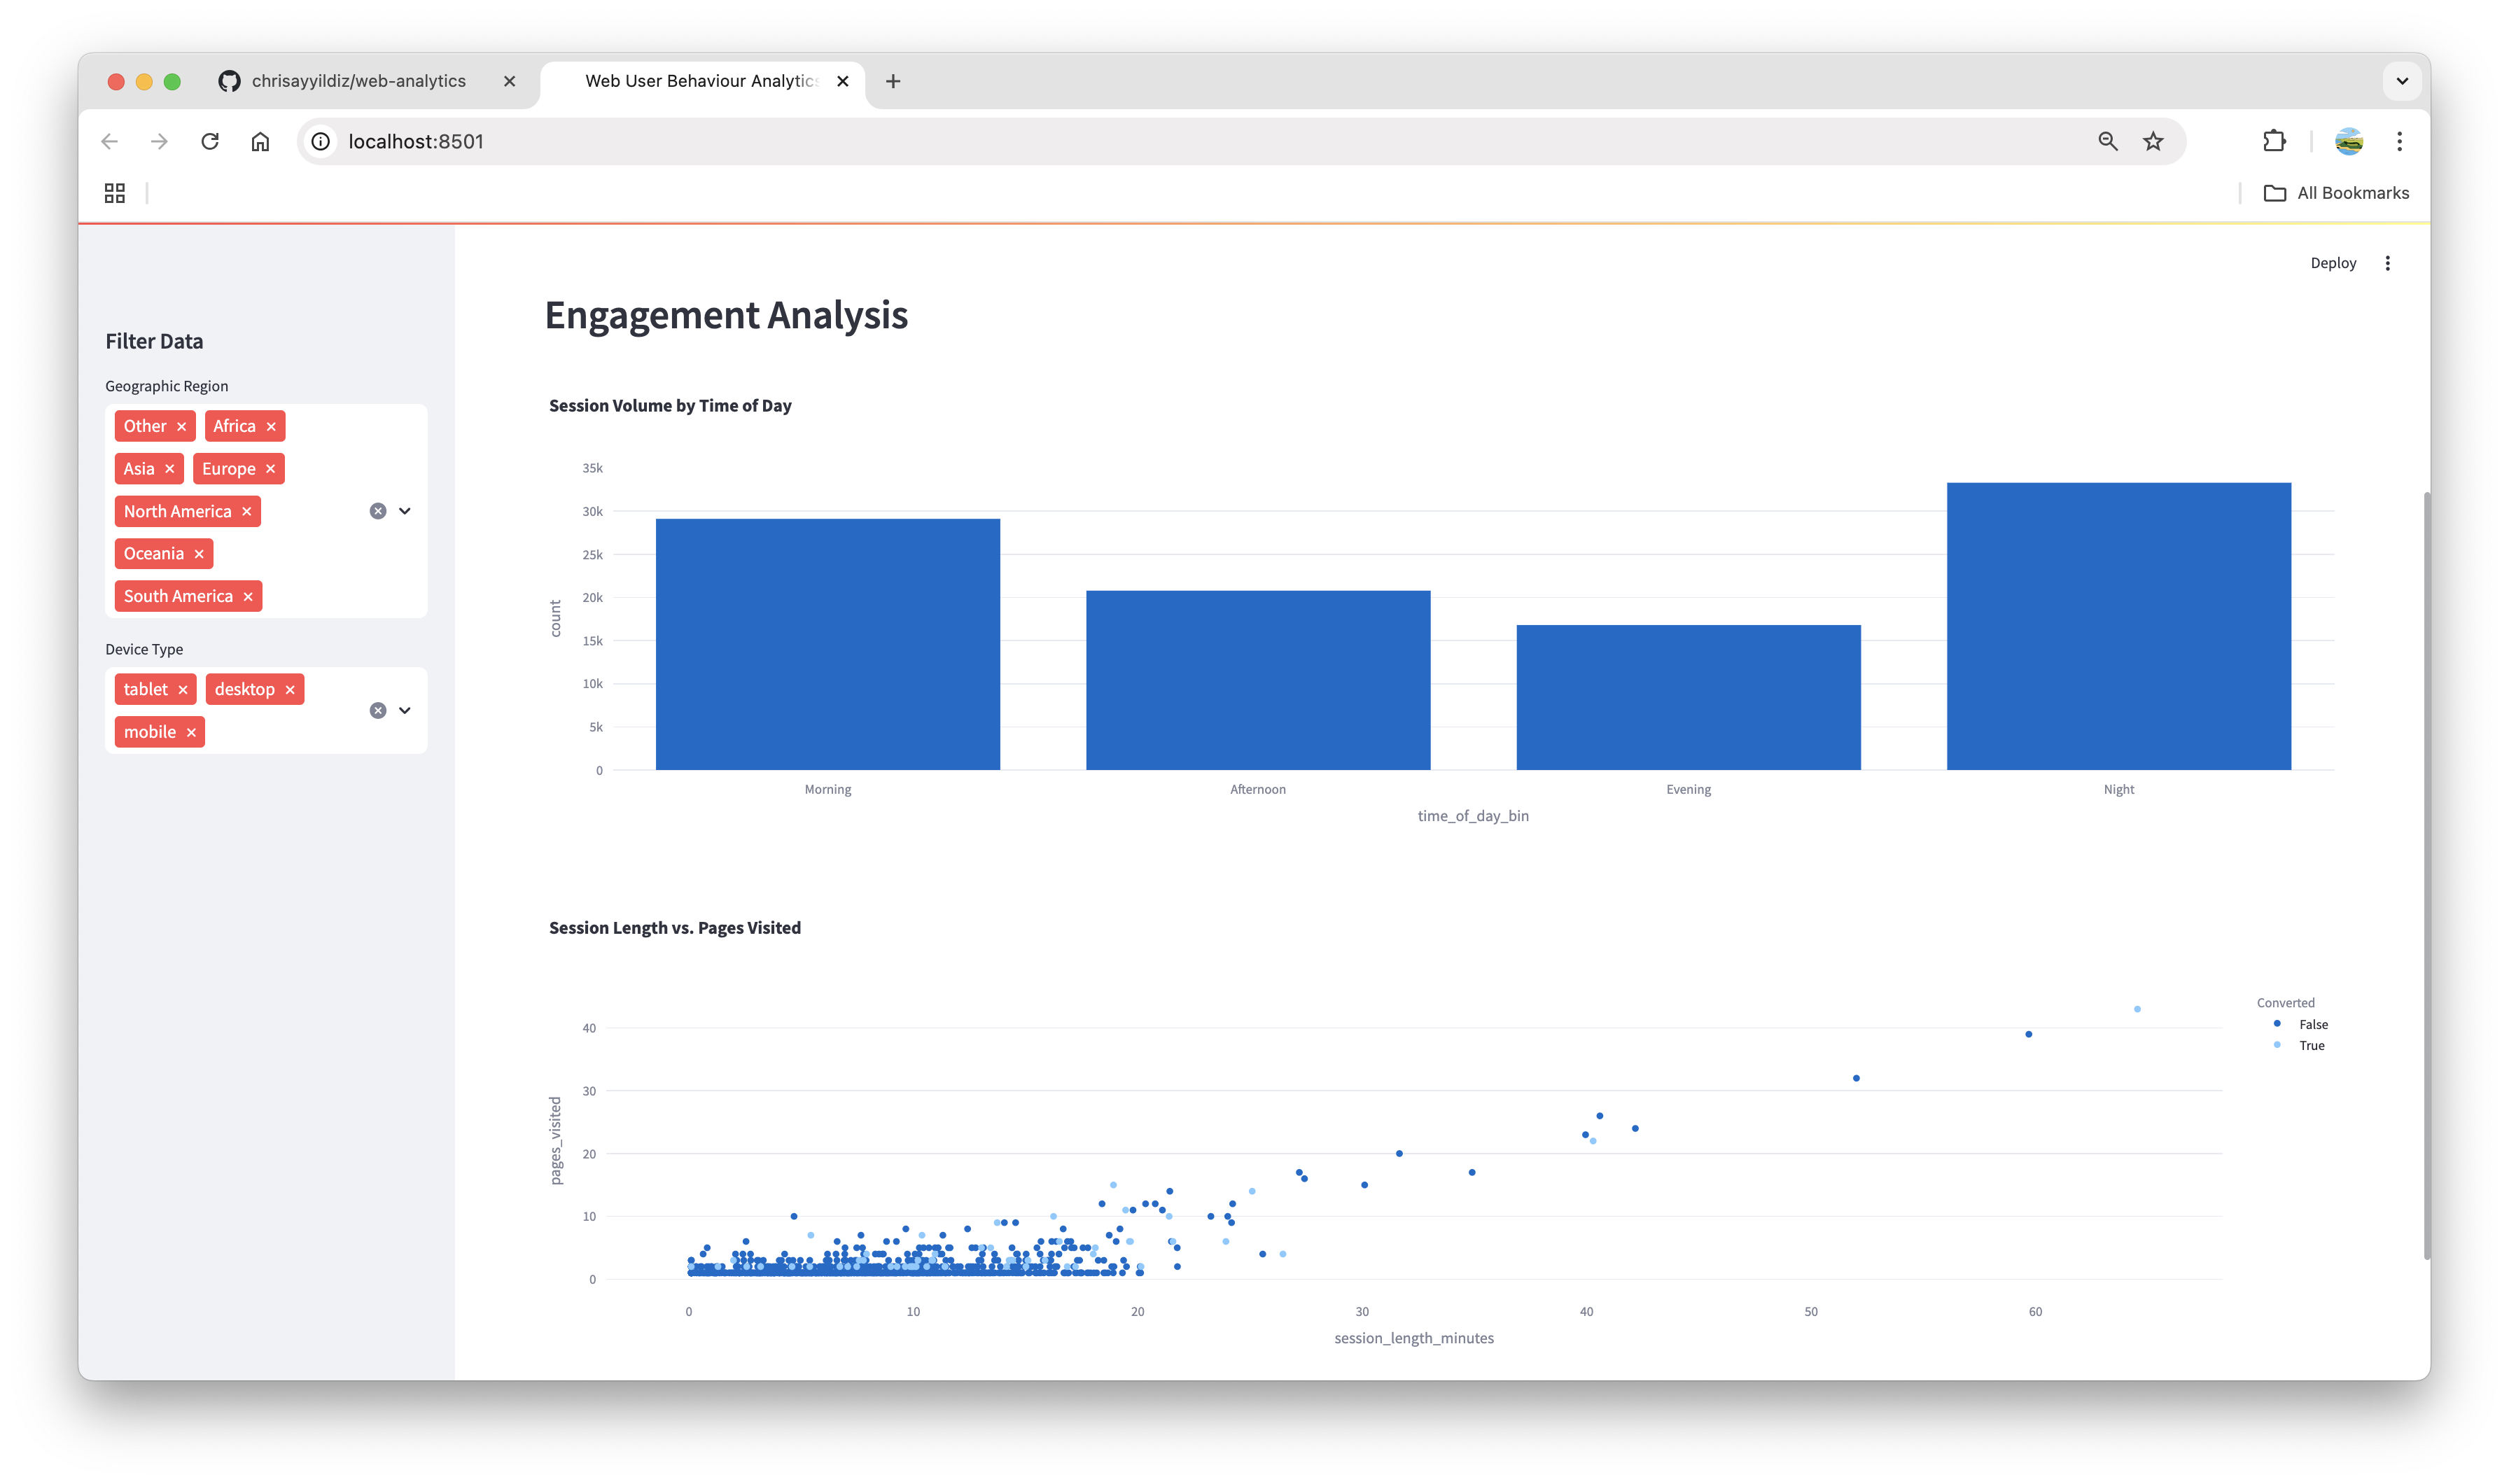
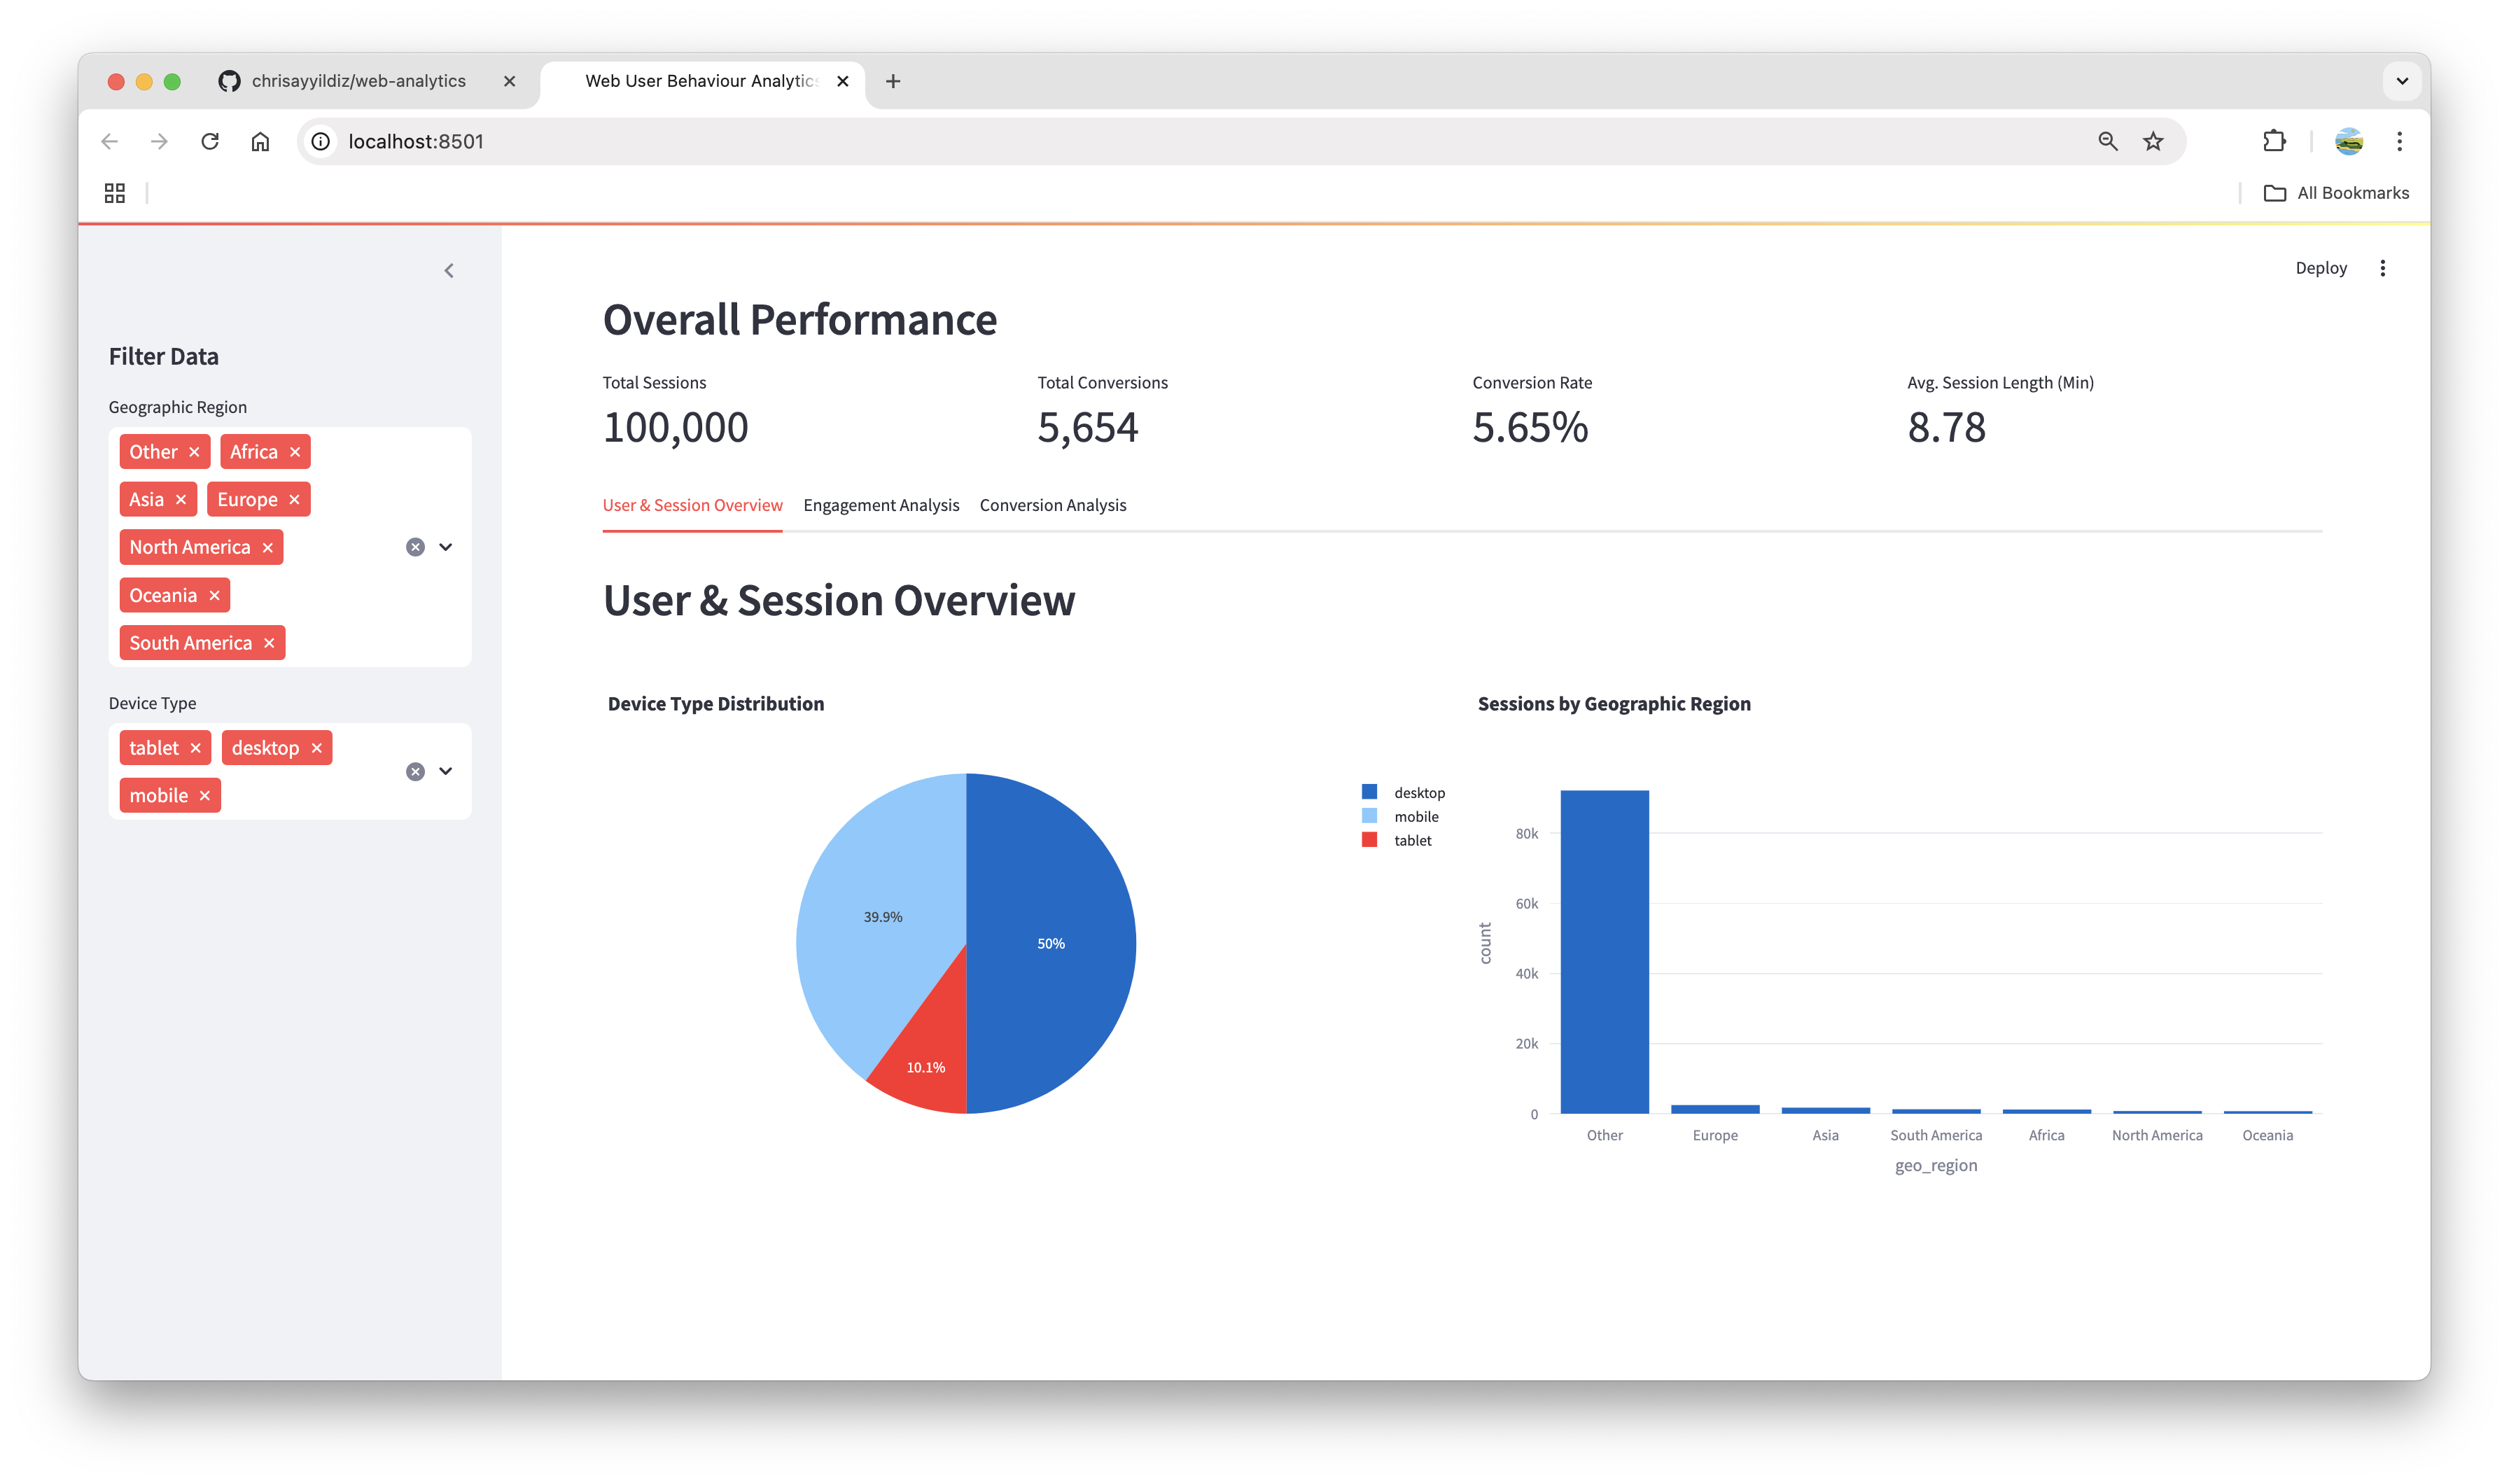
This project simulates realistic web user behaviour using Python and analyses it through an interactive dashboard built with Streamlit. It aims to support business intelligence and UX decisions by surfacing patterns in engagement, session metrics, and conversion behaviours.

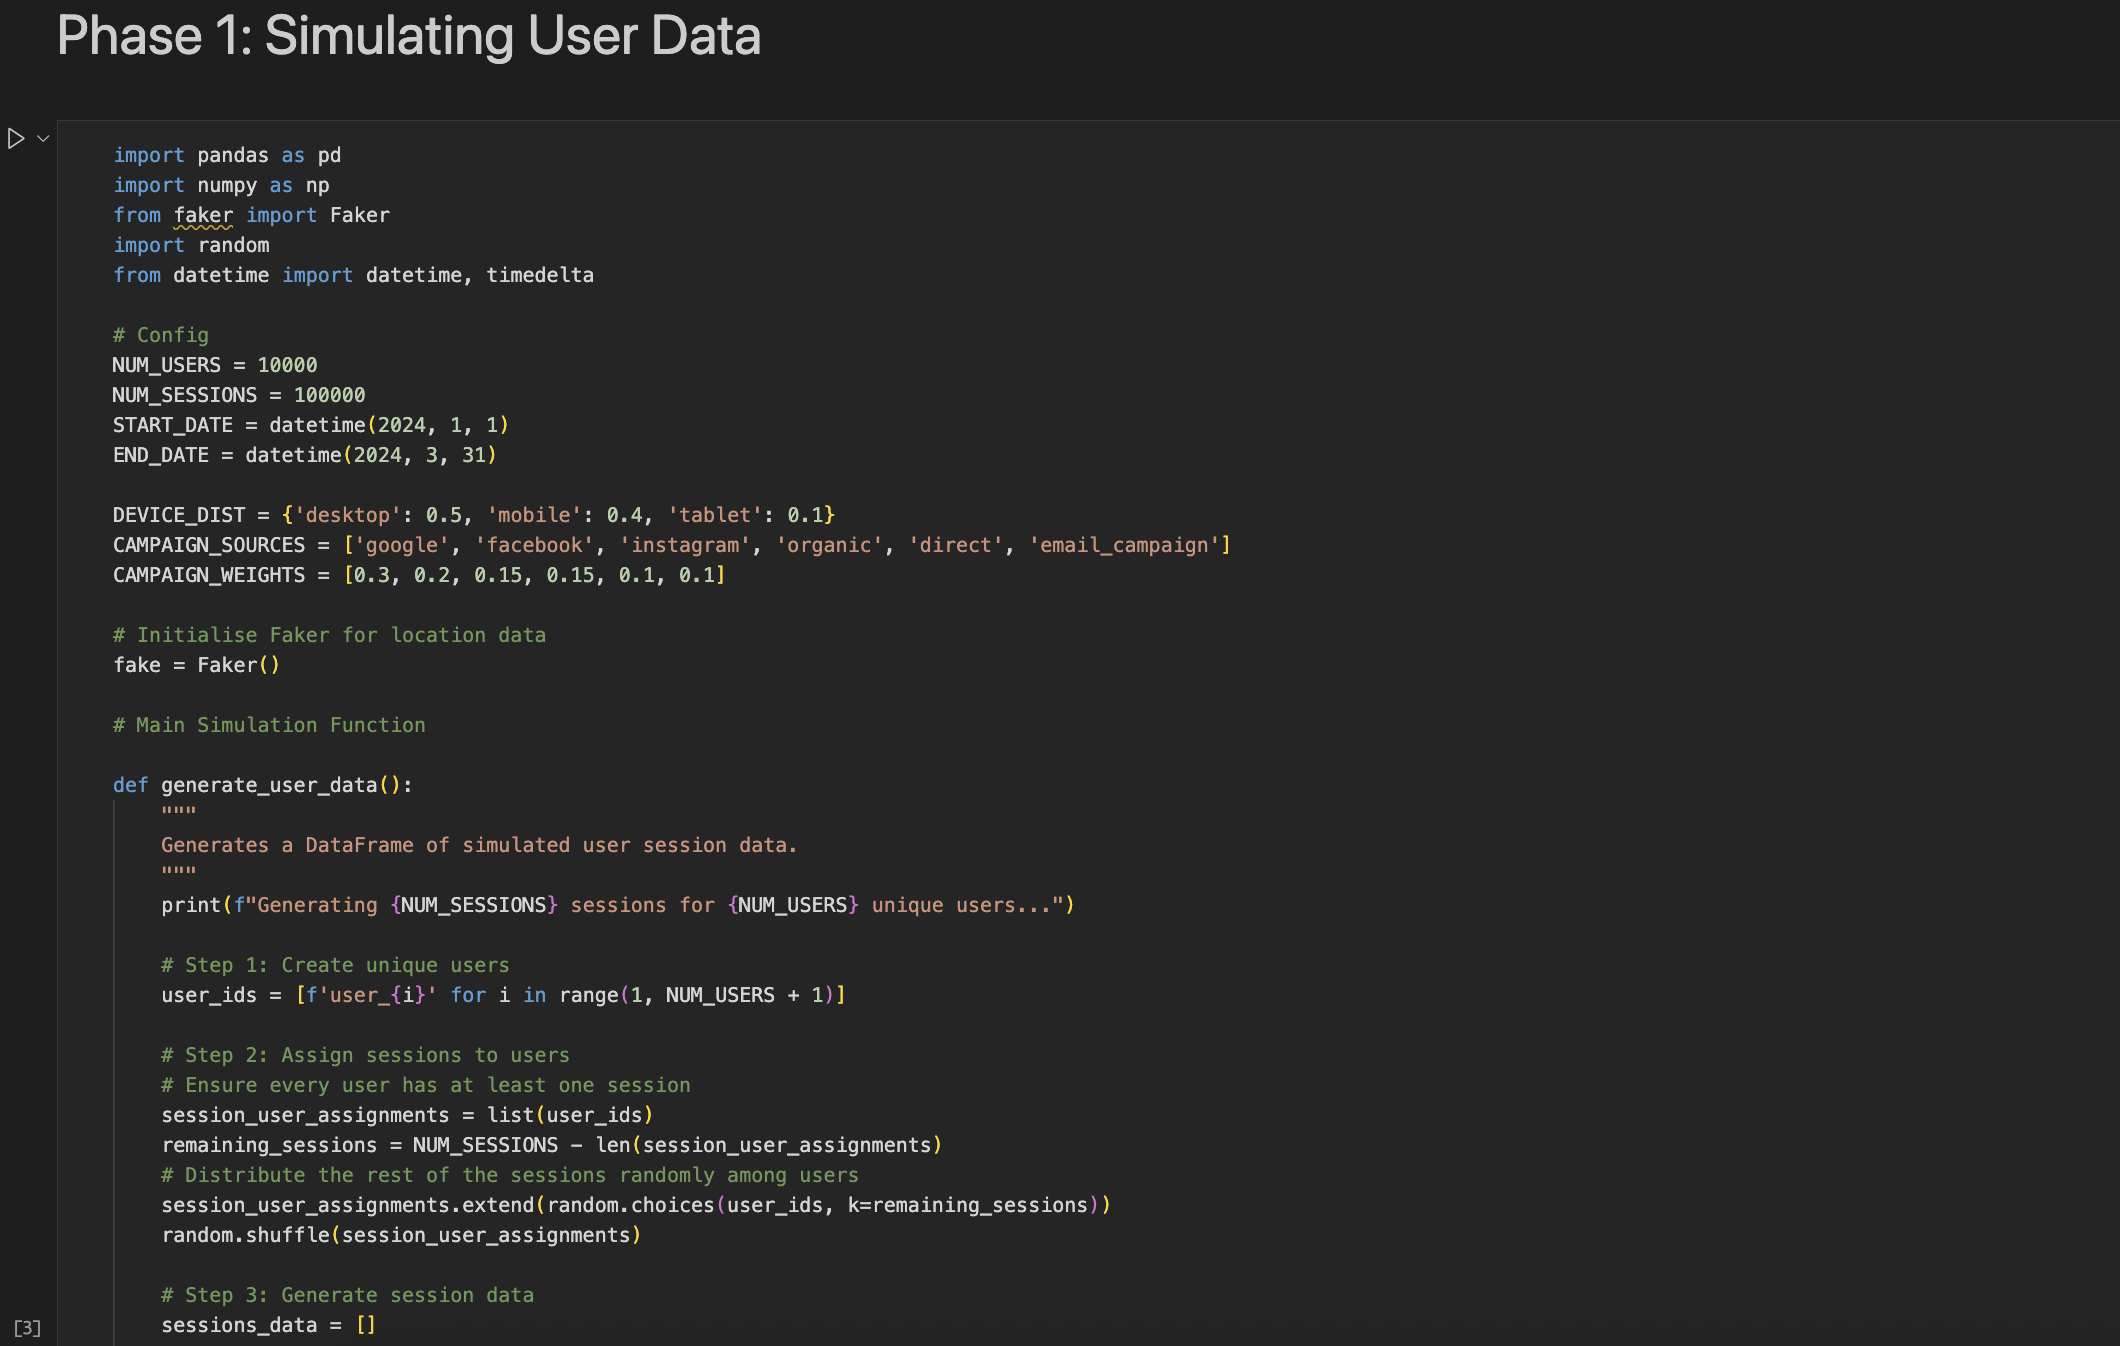
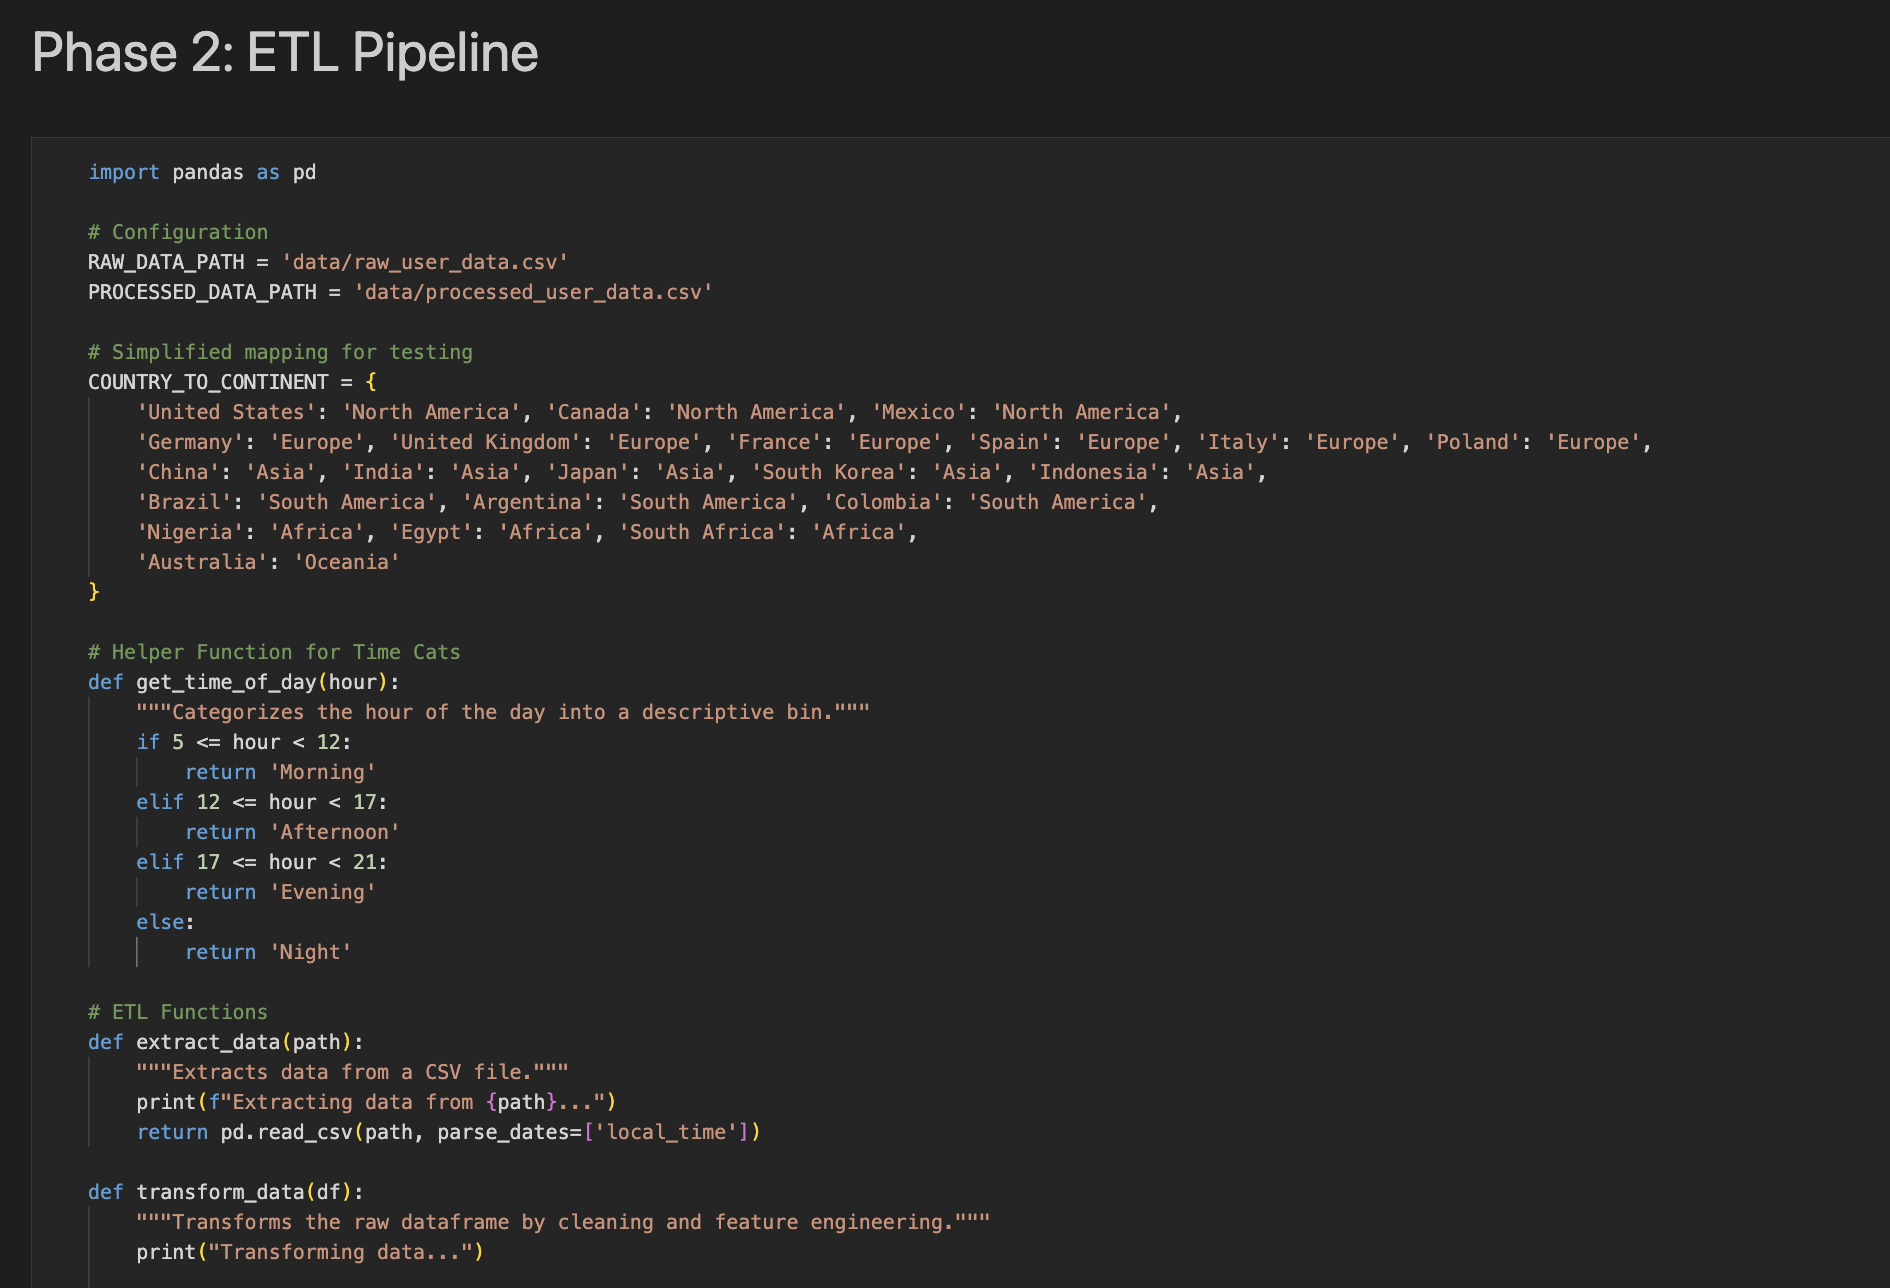
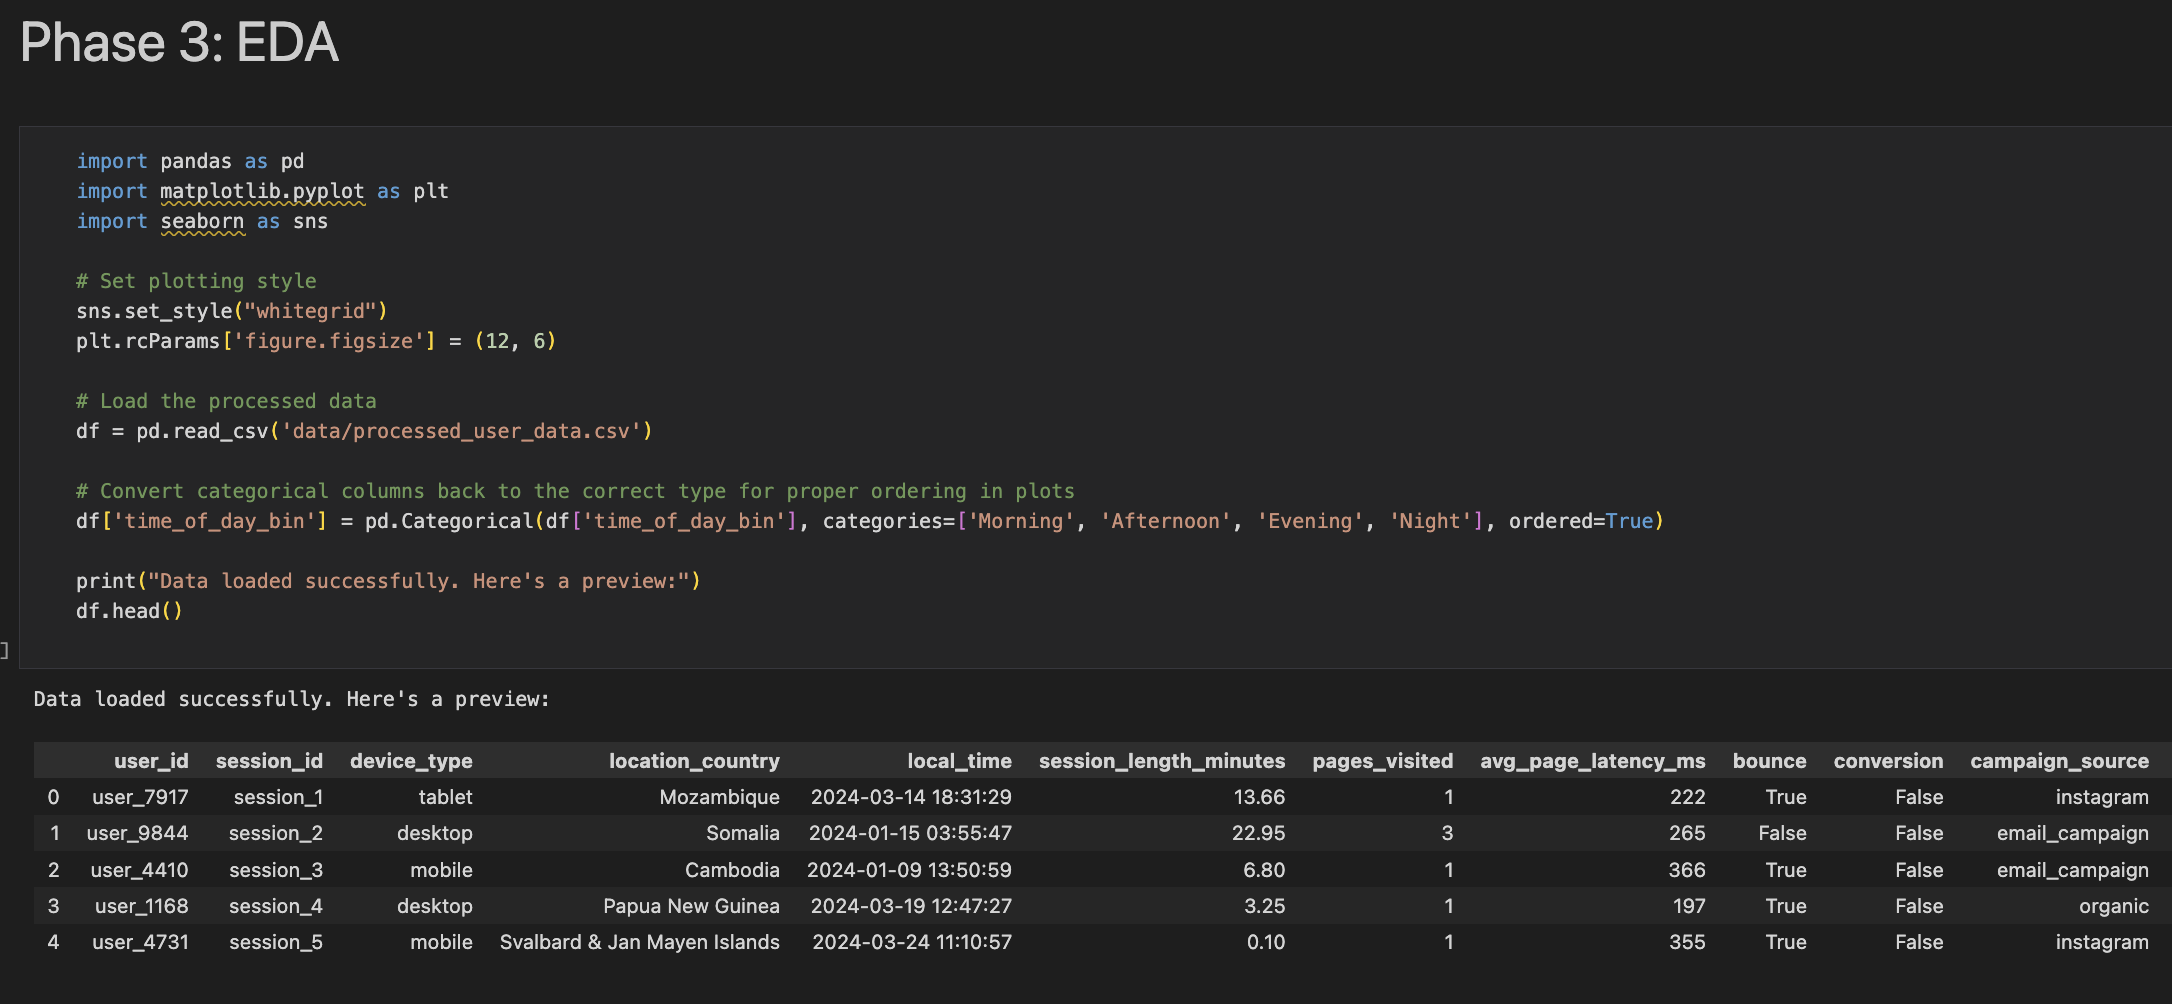
The data, generated with Faker and structured through ETL scripts, includes user location, device type, session metrics, campaign attribution, and conversion status. The result is a full-stack containerised analytics solution ready for future reuse.

The Challenge

  • Understanding how time of day, device, and location might impact user engagement and conversions
  • Creating simulated data that closely resembles real-world web user patterns
  • Building a scalable and reusable platform for future projects
  • Ensuring insights are accessible to non-technical stakeholders

Solution & Approach

  • Developed a data simulation script using Faker to create 100k+ simulated user sessions
  • Constructed a pandas-based ETL pipeline to clean and enrich the data with custom features like engagement score and time-of-day bins
  • Performed exploratory data analysis in Jupyter to identify behavioural trends and conversion patterns
  • Built a Streamlit dashboard that lets users explore device usage, geographic breakdown, session behaviour, and conversion insights
  • Wrapped the app in Docker to ensure easy deployment and reusability across systems

Results & Impact

100,000
Sessions Simulated
10,000
Unique Users
10+
Business Questiosn Addressed
1
Reusable Containerised App
  • Identified high-conversion periods and segments through multi-filter dashboards
  • Revealed device-based conversion and engagement differences with visual clarity
  • Established modular, reusable data generation and dashboard system for future use
  • Created clear value for marketing and UX planning through visual insight exploration

Technical Implementation

  • Language: Python
  • Libraries: Pandas, NumPy, Streamlit, Plotly, Faker
  • Dashboard Tabs: User Overview, Engagement, Conversion
  • Deployment: Docker container (built & serve via 'streamlit run app.py'
  • Data Volume: 100k+ records of user interactions
docker build -t web-analytics . docker run -p 8501:8501 web-analytics

Dashboard Screenshots