Chris Ayyildiz
Data Analytics Projects
8 Projects
Live Funnel Analysis
Simulates live e-commerce user activity through an interactive funnel to monitor, visualise and improve user conversion pathways. The project features a real-time ETL pipeline and an interactive dashboard to identify potential drop-off points.

Access Transport
Automated ETL pipeline identifying live TfL accessibility disruptions via their unified API. Ingested data is processed with Airflow and outputted to a Streamlit dashboard enabling users to find relevant real-time accessibility issues.
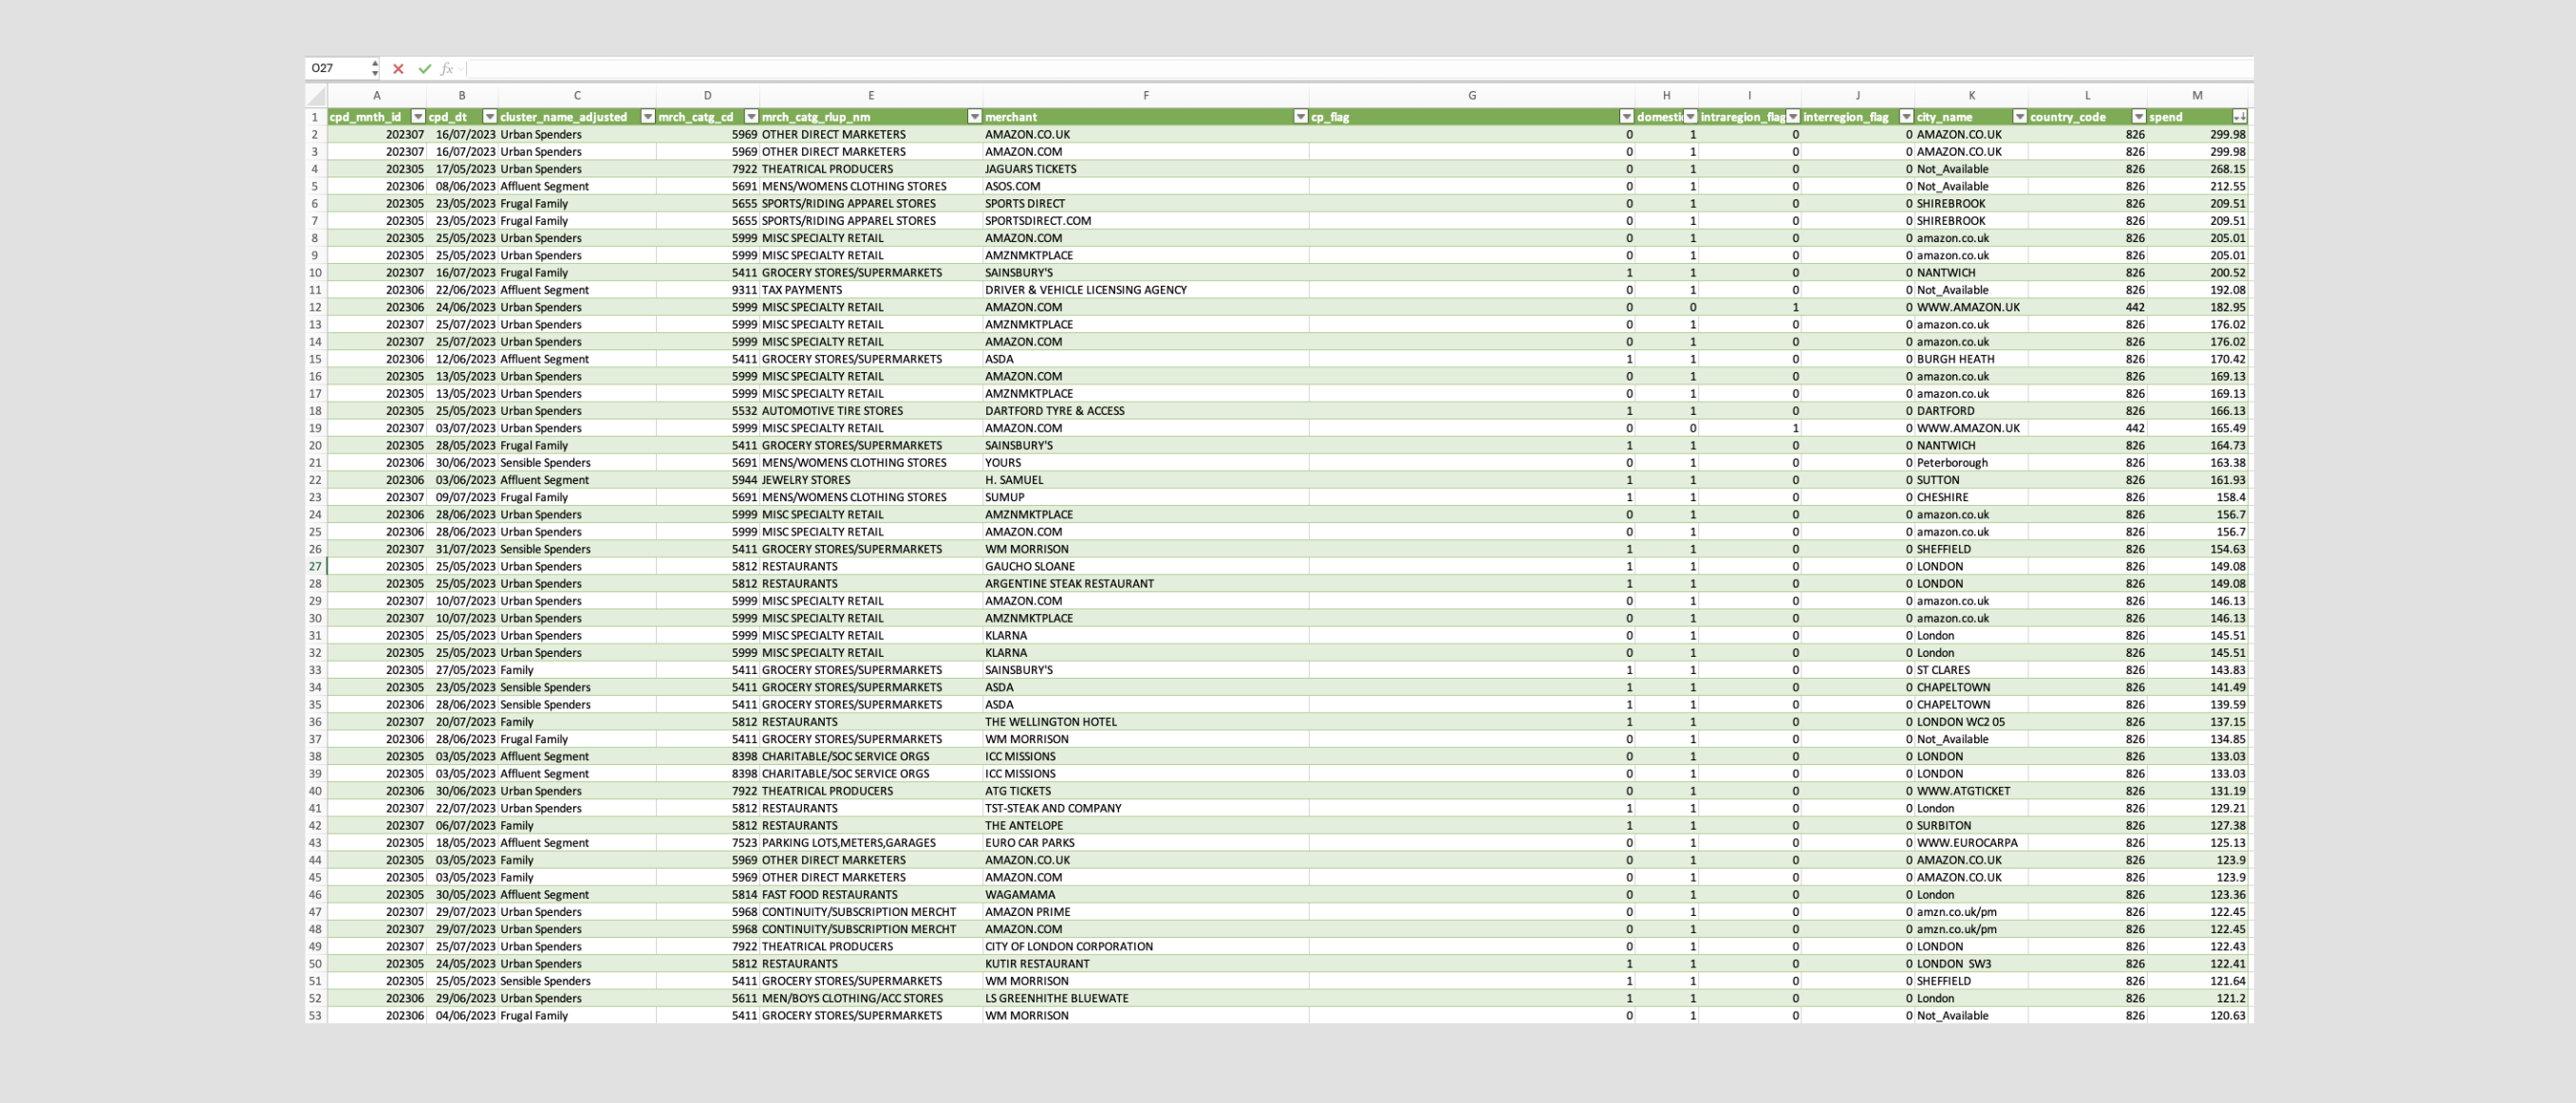
VISA Climate Hackathon
Worked with a 500k+ row dataset of anonymised transactional data to identify trends in fast-fashion spending. I mapped spending to carbon footprint estimations using gov.uk conversion factors and resolved significant mismatches in column entries.
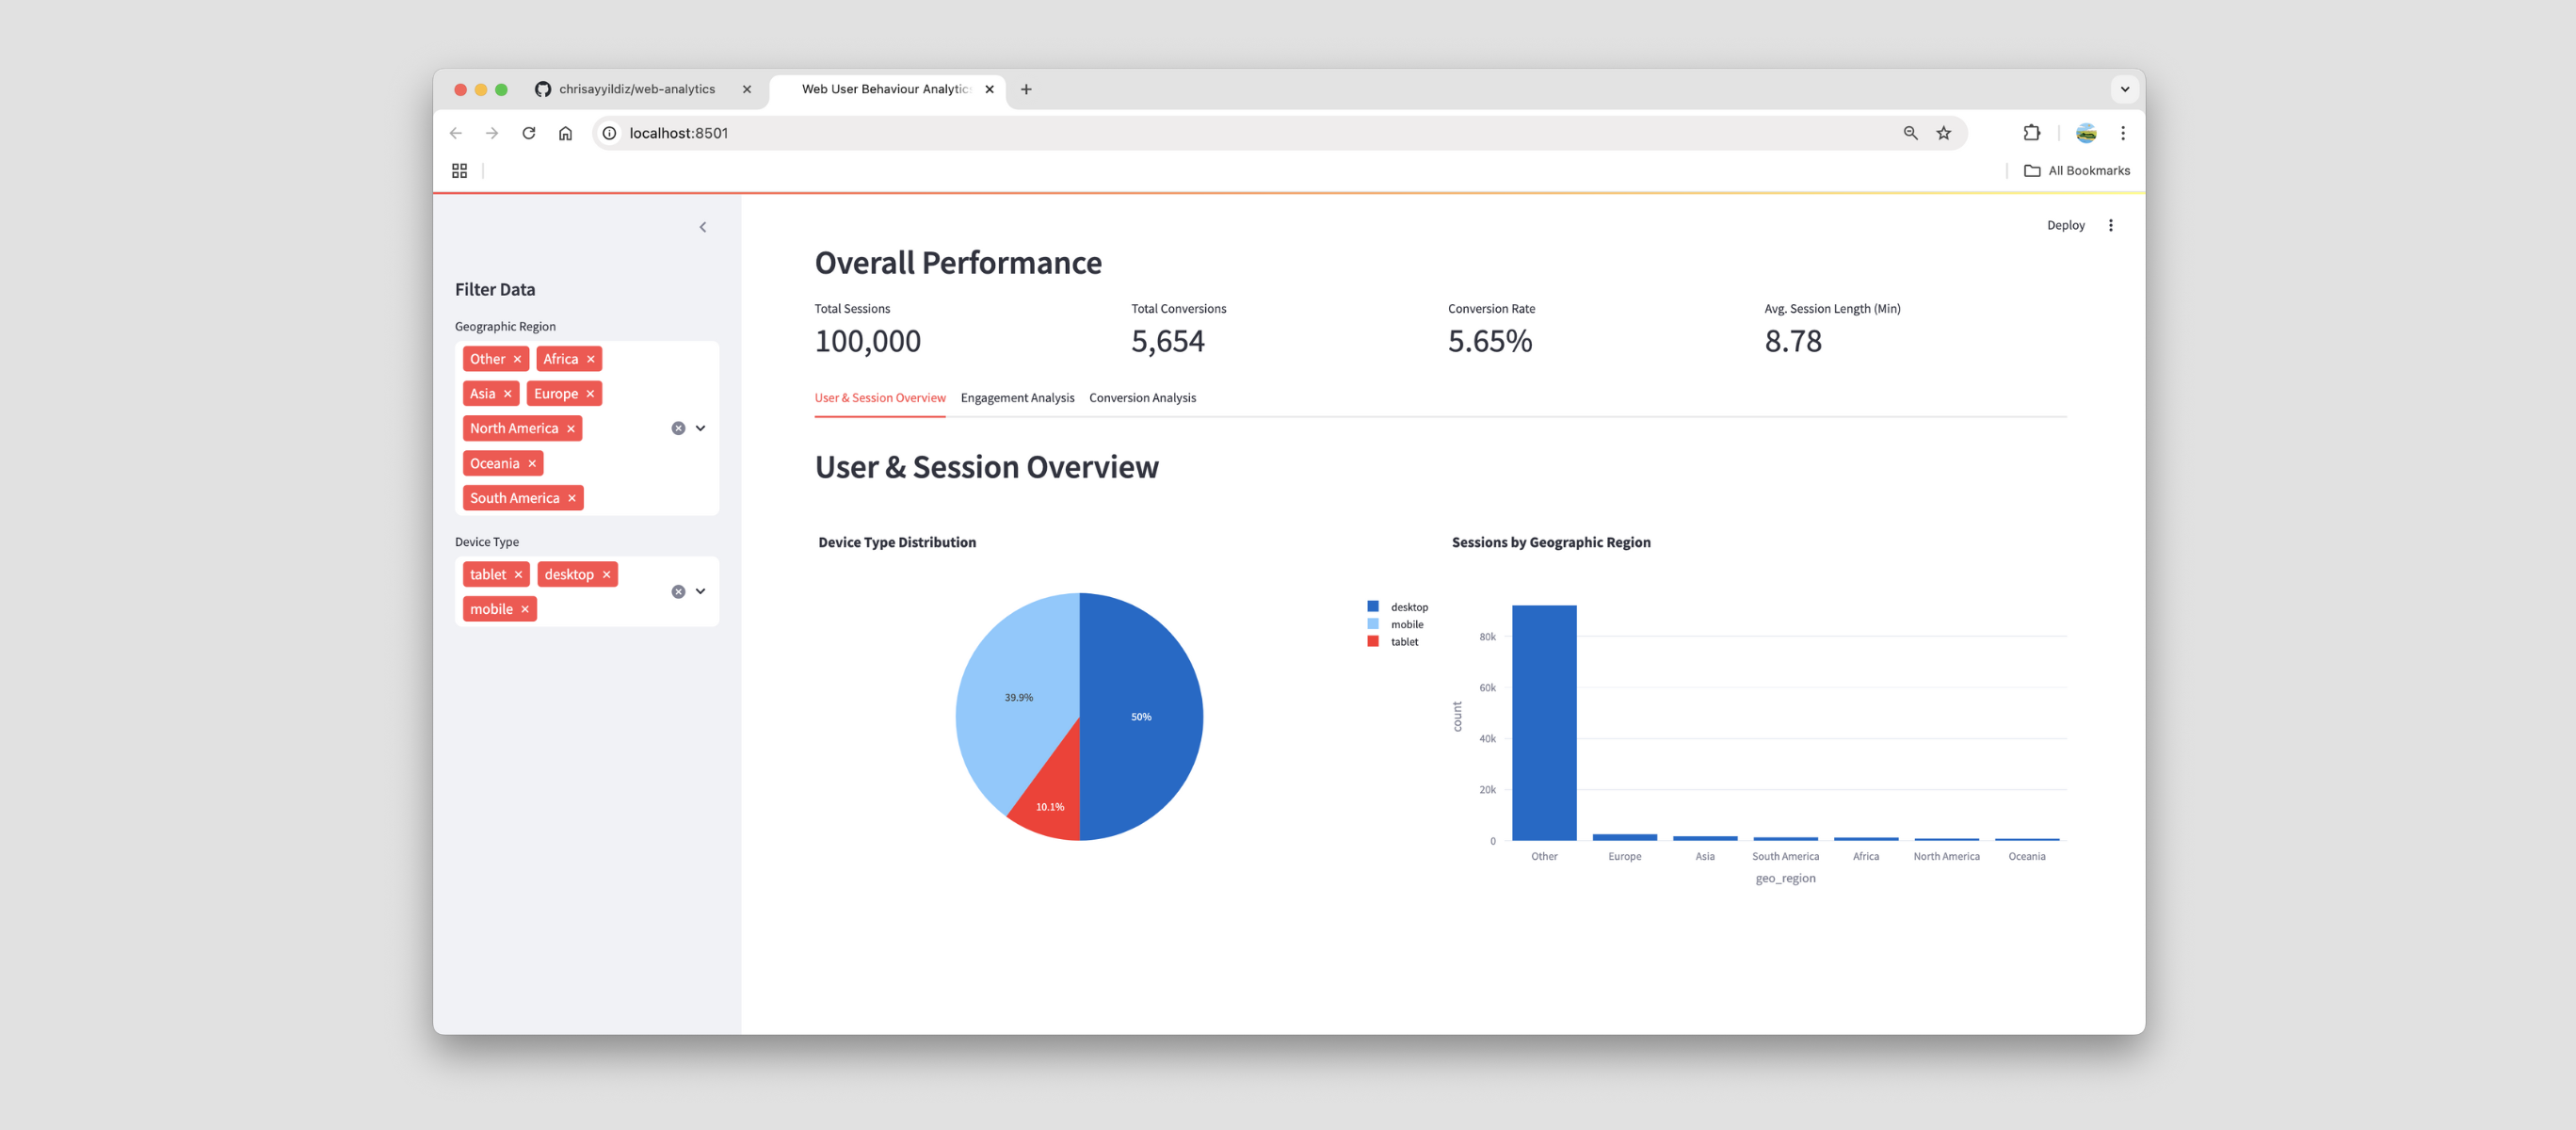
Web User Behaviour Analysis
Simulated 100K+ web sessions using Python and Faker to analyse web behaviour, identifying patterns in engagement, session metrics, and conversion. Fully containerised for rapid reuse.
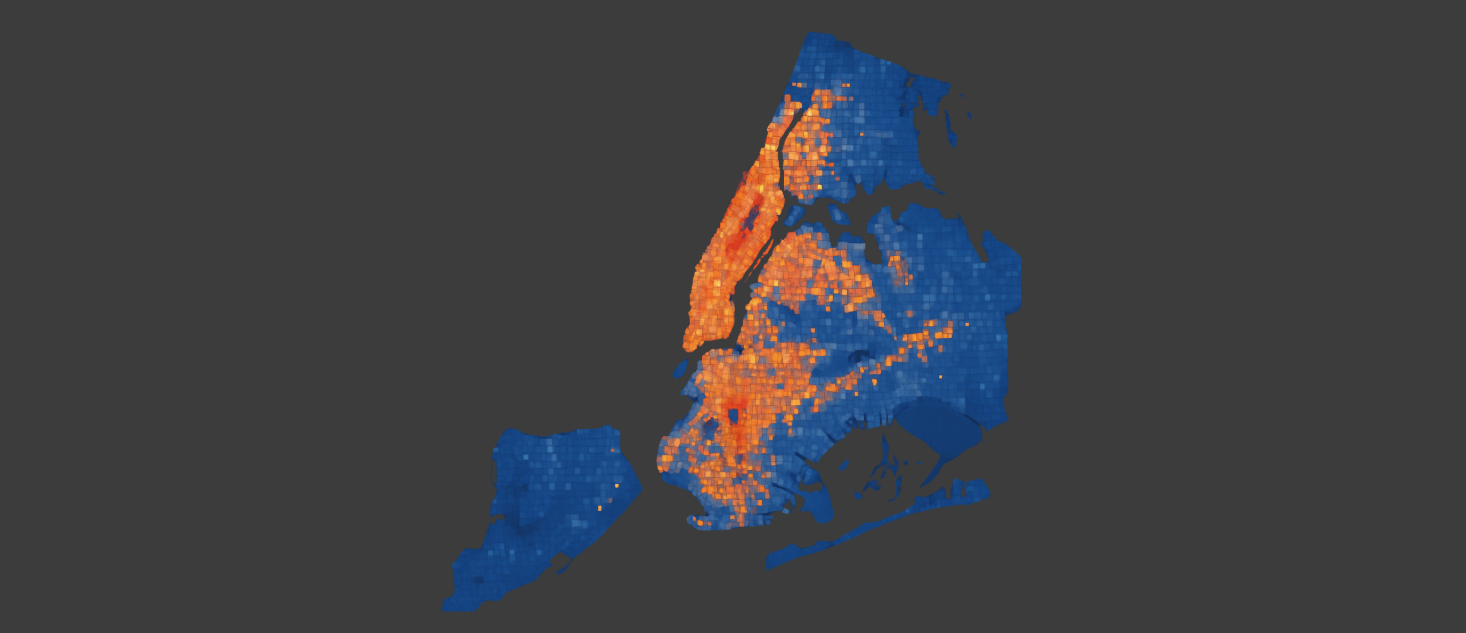
NYC Taxi Demand Analytics
This project analysed over 1.2 billion NYC Yellow and Green Taxi trip records to practice using large scale cloud tools for data analysis. Key outcomes for the project included a peak demand heatmap spaced across time periods, revenue per mile trends throughout the past five years, pick up cluster spots, and trip duration anomalies. The project used the GCP as part of Google's Machine Learning Engineer Pathway.

KPI Tree (NHS Metrics)
Real-time NHS provisional care quality KPI board to track performance status. Utilises web-scraped data and recent public databases to collate KPI data in a React dashboard.
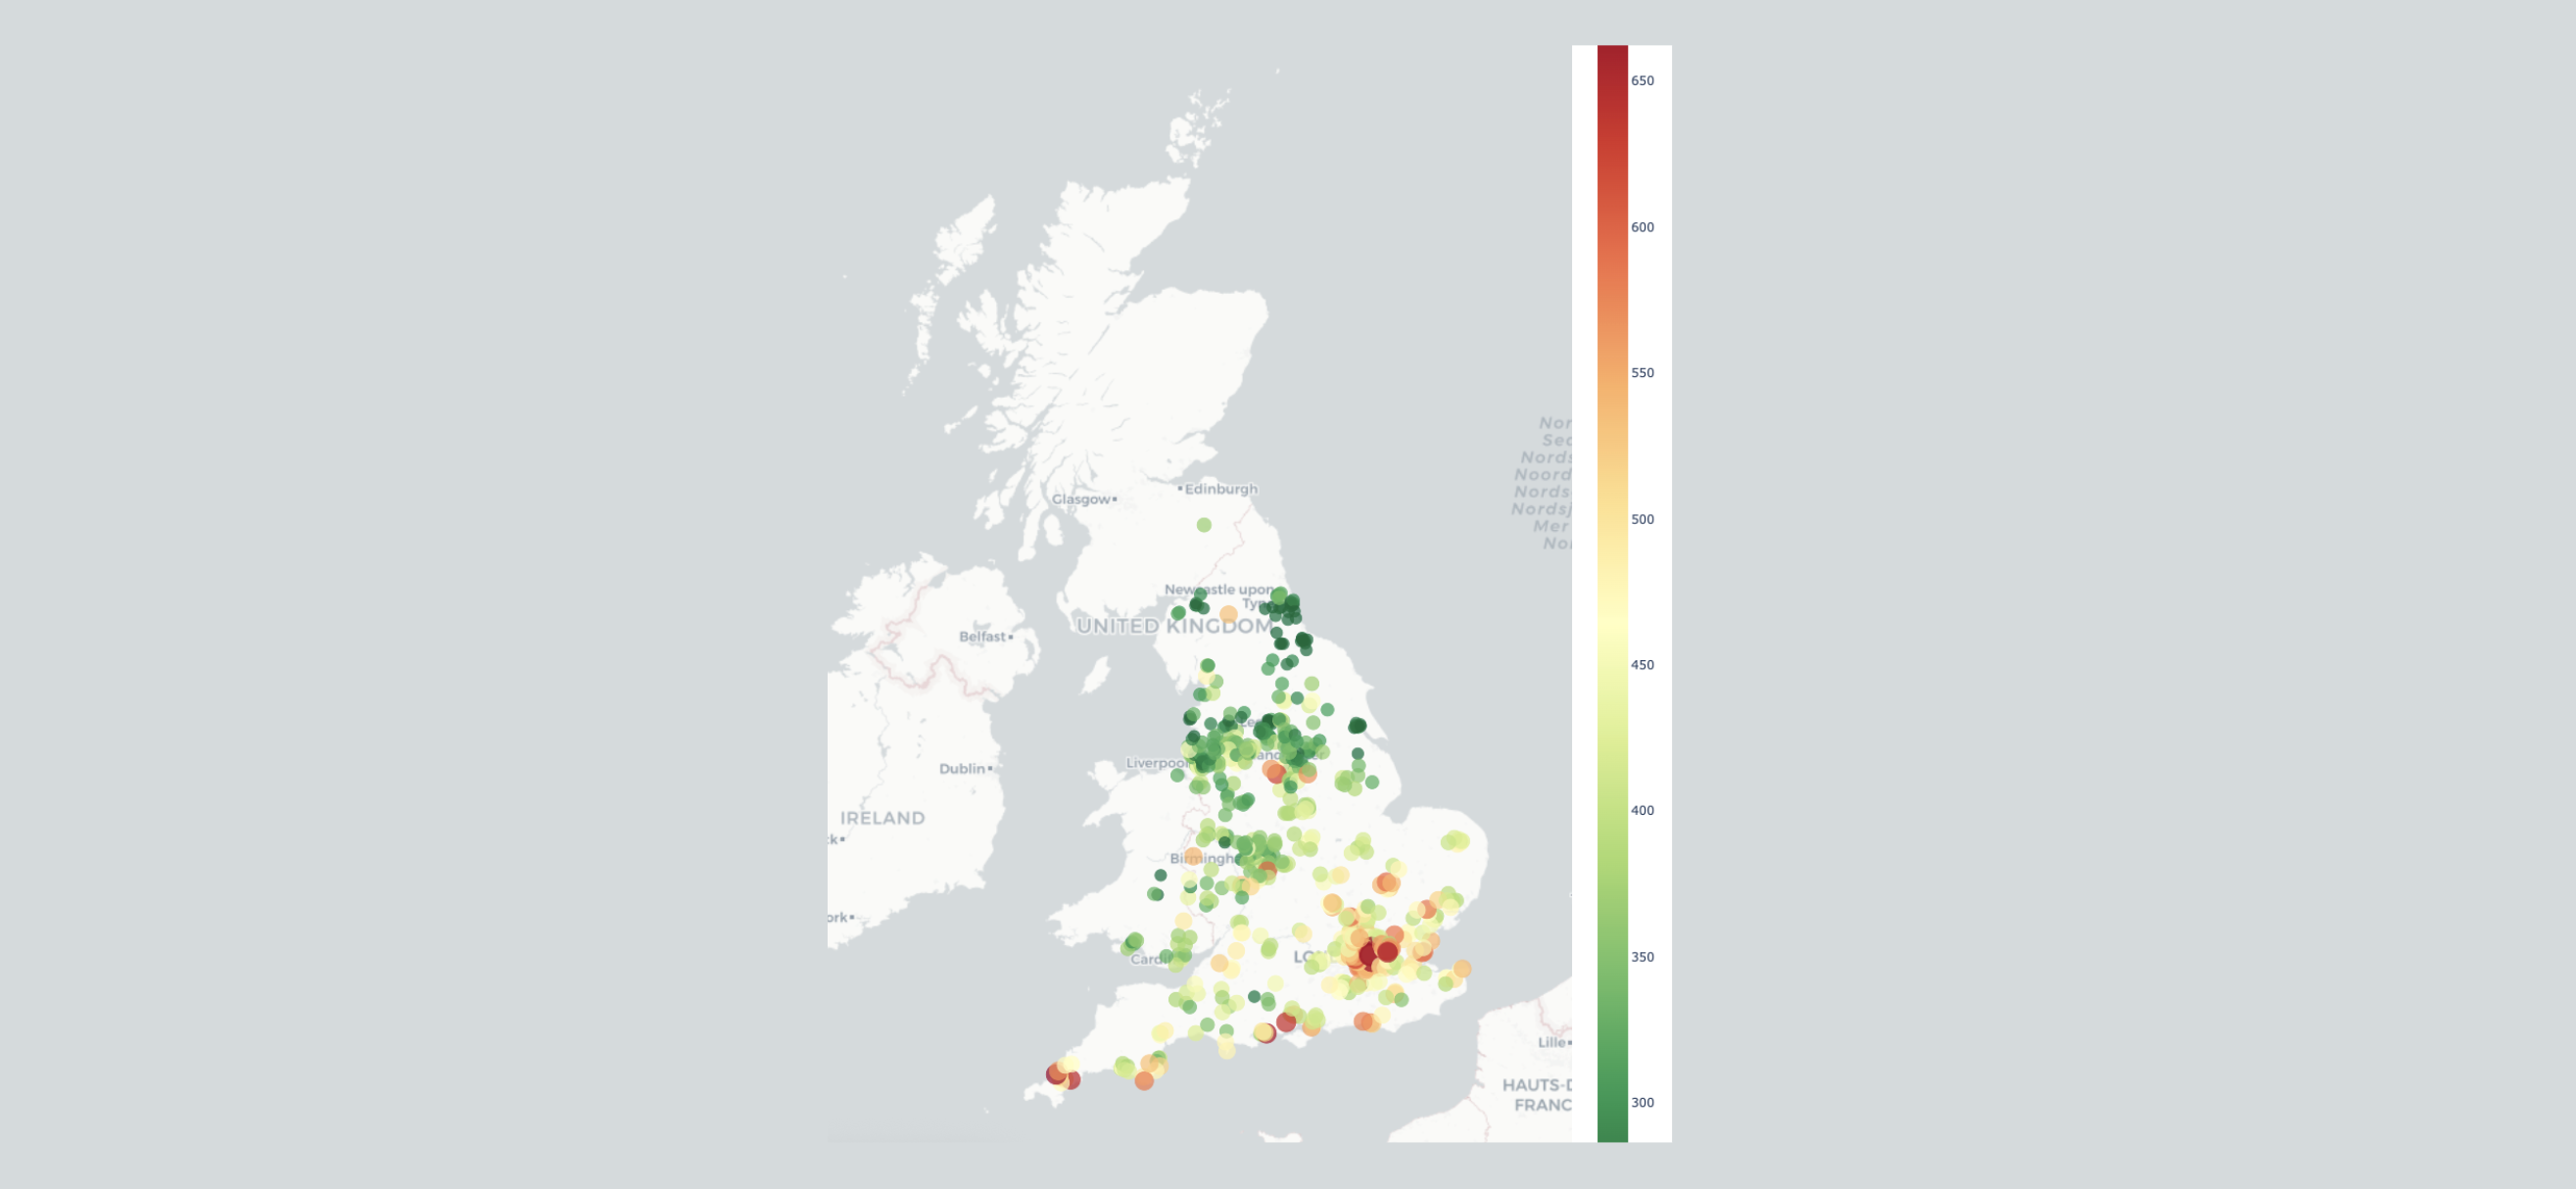
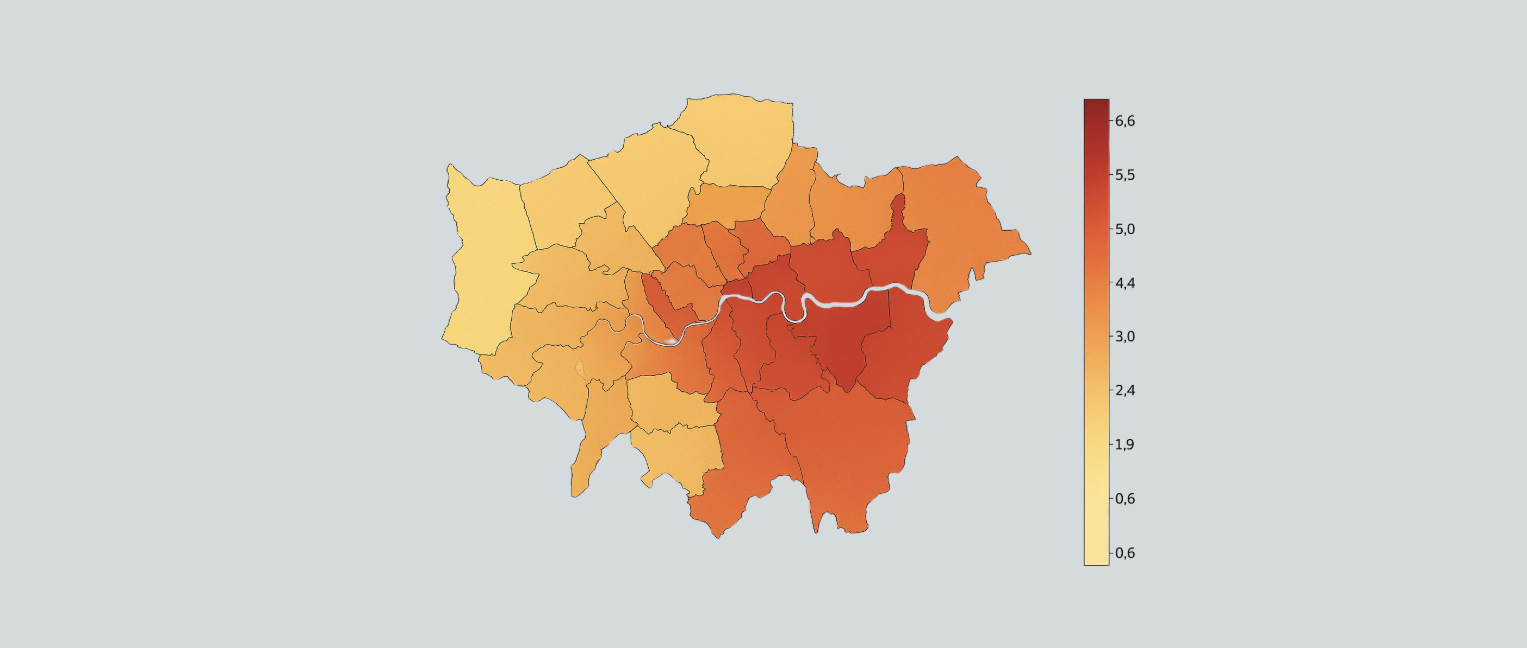
UK House Price Change (1995-2024)
Visualises data from the England & Wales Land Registry Price Paid dataset on a regional scatter heatmap across 2024 and 1995.
Global Urban Heat Island Visualisation
This project visualised the significance of the Urban Heat Island (UHI) effect across global cities over the past three decades. I used LST data and urban boundary shapefiles to generate an clear heatmap graph comparing cities to their rural surroundings.
